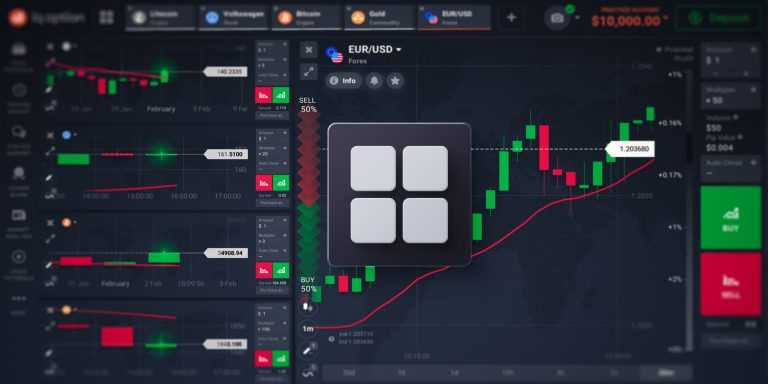
In order to enhance your trading, you don’t always have to use complicated techniques. You just need to know about all the possibilities that are available to you in the traderoom. If you have never tried to use multicharts, this may be a great insight and a complete change to your trading approach.
What are multicharts for?
The multichart option on the platform is made so that you could simultaneously trace price changes on different assets by opening several windows. This could not just save you time, so that you don’t have to change between tabs, but also provide you with more information about the assets. Advanced traders utilize multicharts on a daily basis and use it as an aid to their technical analysis strategy. There are several ways in which you could implement this feature.
Trade several assets at the same time
The most obvious way to incorporate multicharts into your routine is when you trade on different assets, so you can have several charts opened at the same time. This way, you could monitor your open positions, track assets’ performance and catch the optimal entry or exit moment.

This method would be particularly useful for traders with a large portfolio. If you trade different types of instruments: for instance, Forex and Stocks, or Crypto and Commodities (or maybe all of them at once), you can check your deals without unnecessary distractions.
Compare timeframes
Another way to utilize the multichart option is to check the same assets, but on different timeframes. Even if you only exercise a certain type of trading, for instance, only long-term or solely short-term, it could still be useful to double check the trends for other timeframes: the information may differ.

For instance, in the screenshot above, a trader can see that short-term (on 1 hour frame) the AUD/USD asset is going up, however, on a 7-day scale, the trend is downward. Applying different technical analysis tools, like indicators, could also be convenient with a multichart.
Track correlations between interdependent assets
It is not a secret that many assets have a direct or an indirect relationship. For example, the price of gold correlates with the US dollar: whenever gold is up, the US dollar tends to decrease in value and vice versa.

Another good example is the Norwegian krone, which is a commodity currency and its price largely depends on Crude Oil Brent price in particular. By opening such assets simultaneously, it is possible to track the correlation between them and strategize your approach in a more informed and efficient way.
How to apply a multichart?
In order to use multicharts, it is sufficient to click on the “Chart layout” button in the left upper corner and choose the prefered layout.

It is possible to have up to 9 charts open at the same time, which gives you a lot of room for experiments. Now that you know all the different ways to utilize this feature, you are welcome to try it out in your traderoom!

