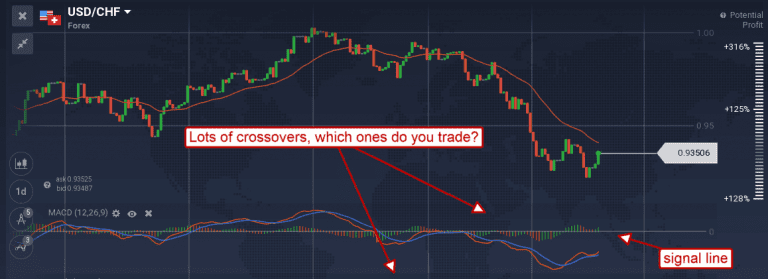
Crossovers are one of those esoteric aspects of technical trading that sets the initiated and non-initiated apart. The knowing of them is one thing, the using is something entirely different. Like all types of signals, crossovers are cold and heartless. A bearish signal may occur in a bull market, a bullish one in a bear and neither are good points of entry.
First, what is a crossover? This is a technical point of entry accepted by most traders that may occur with a moving average, oscillator or other type of indicator. For this discussion I will stick with oscillators like stochastic, MACD and RSI as they are the most commonly used on a day to day basis. The crossover forms when one or more lines within the oscillator graph crosses over the other one, hence the name crossover. This usually indicates a change in price direction and can often be used as a profitable point of entry.
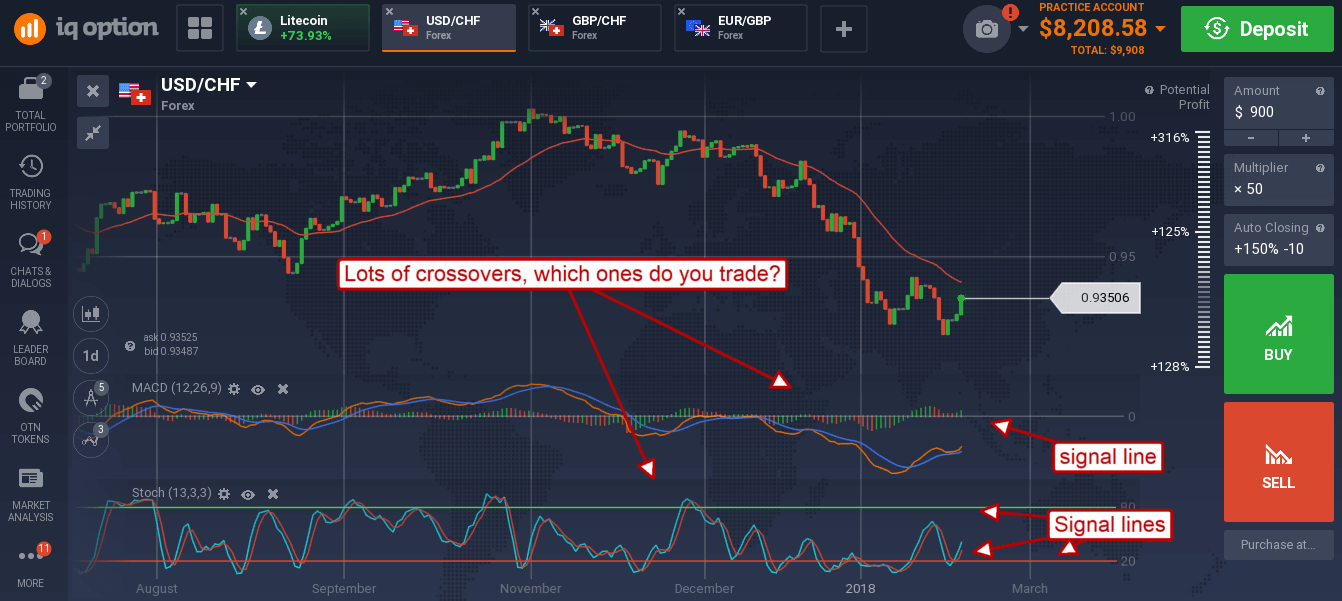
The crossover can form in many ways depending on the oscillator. The MACD histogram only has the one signal line, the zero line, so can form crossovers in only one way while the MACD oscillator has two and the center line. RSI may form a crossover of a lower or upper extreme level, or the midpoint at 50 while stochastic has many types of crossovers. Stochastic has the %D, the %K and two extreme levels that may all be crossed in one form or another.
One of the key principles of technical trading is to weed out bad, false and lower probability trades. One method doing that is to follow the trend and that can be easily done with oscillator type indicators. In fact, the trend following crossover is one of the more powerful tools in a technical traders’ arsenal but not all are the same. Finding the trend can be done in many ways, once you establish what it is only crossovers that form in the direction of that trend are to be trusted. Forex and CFD traders may use the non-trend following crossovers as point of exit or profit taking once a trade has been entered.
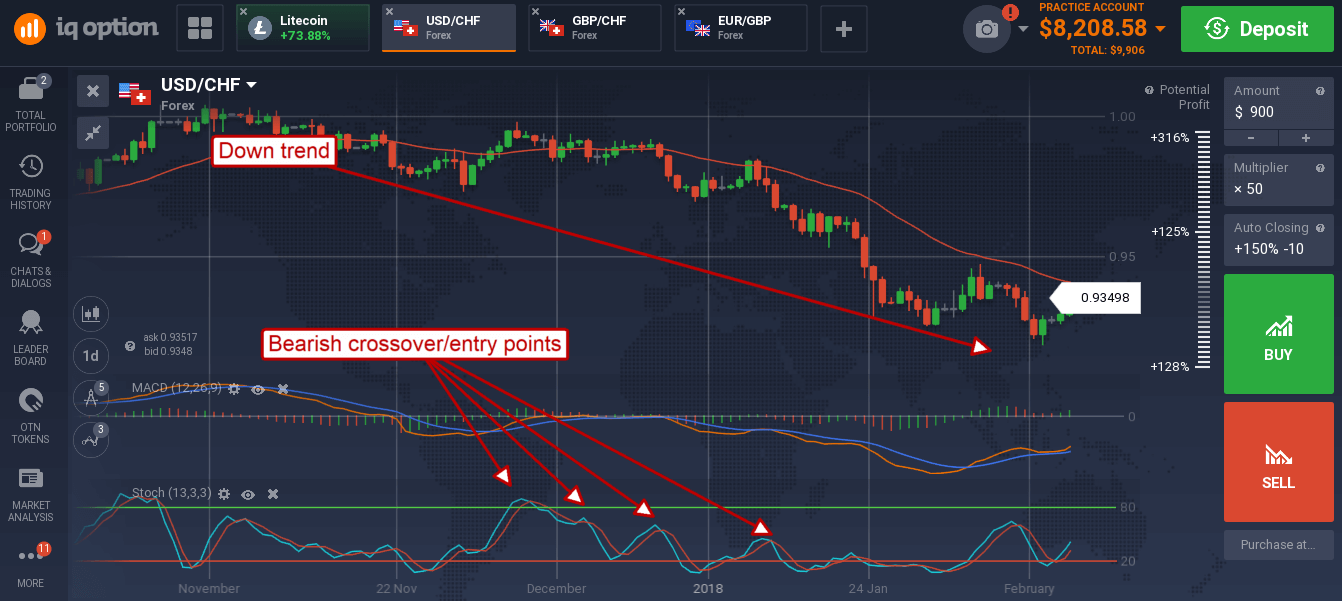
Once you are focused on the trend following crossovers there are at least two types of those as well, an early and/or weak trend following crossover and a stronger or follow-up trend following crossover, depending of course on which oscillator you are using. In the first, the weak or early crossover (using stochastic as a reference), the main signal line may be pointing down or trending flat when this entry point appears. It usually happens early in the correction and consolidation process and is often a signal that stronger, higher probability entry points, are on the way.
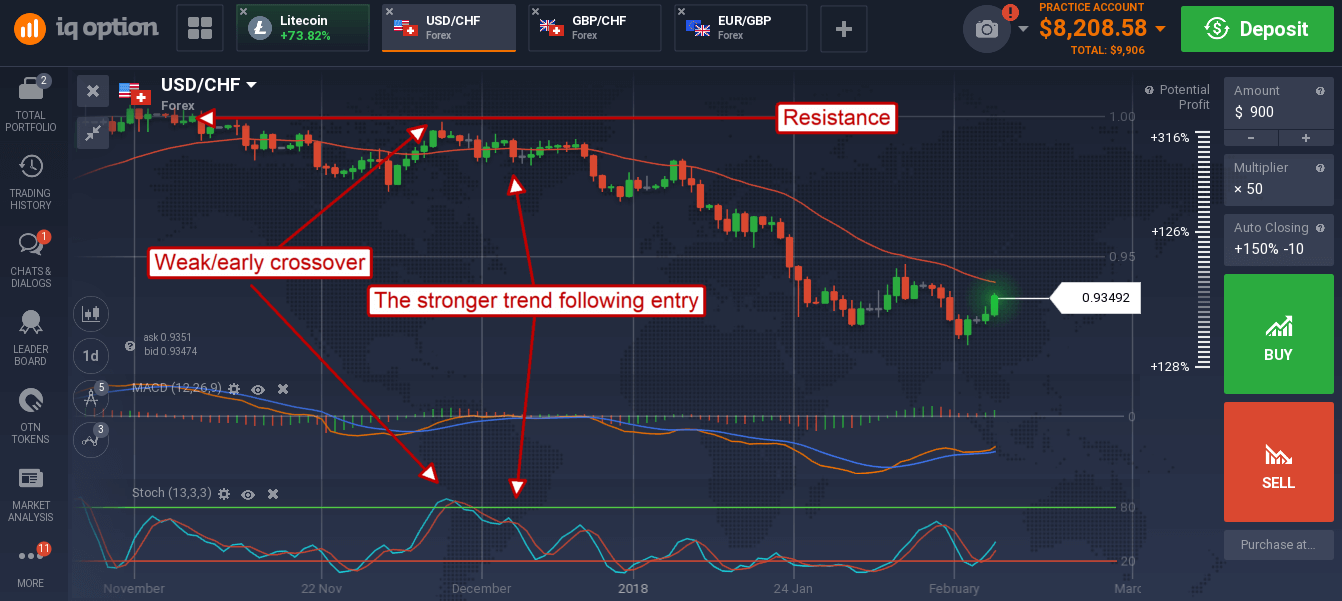
The stronger, or follow-on, trend following crossover is one of the best entry points I know. The problem is that on a daily chart they may only come once or twice, maybe three times, per year. Shorter term traders will have better luck finding them but still won’t find them every day. These crossovers form once a correction, consolidation or pull back in prices has occurred and a first bounce has given indication of support/resistance depending on the trend.
That was the weak trend following signal; after it forms there is usually another small consolidation or pull back to support which forms the strong signal. The strong signal is when both the %K and %D lines are moving higher and are strongest when the crossover forms at a slightly higher level than the first, weaker, signal.
