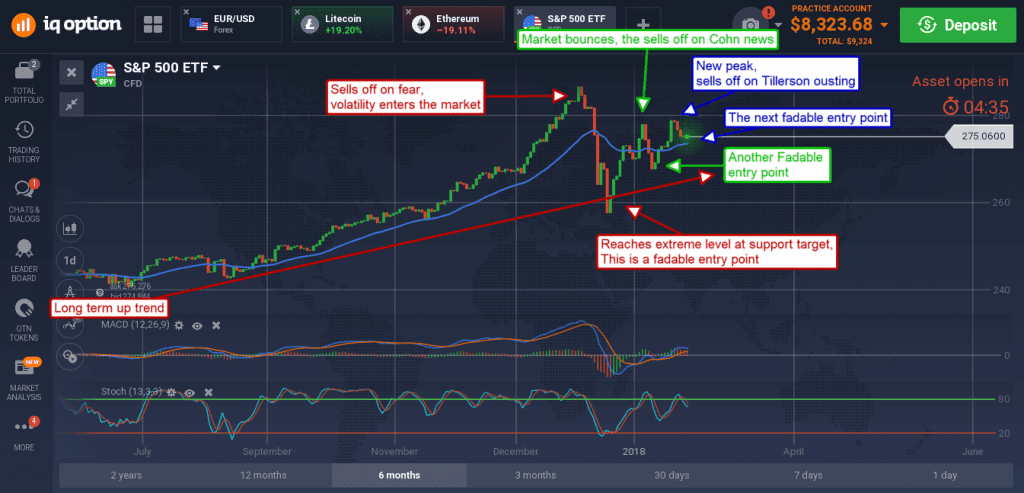
Global equities have been held in check by a round of events that have shaken the very foundations of global trade. Not only has US President Donald Trump embarked on a path many pundits fear will lead to trade war, he has lost one adviser well-trusted by the market and fired another. Gary Cohn’s resignation was really no surprise as his problems with Trump’s protectionist agenda are well known. The ousting of Secretary of State Rex Tillerson, to be replaced by current CIA director Mike Pompeo, was met with harsh criticism.
Pompeo, know to share some of Trump’s protectionist feelings, is expected to take a hardline stance against countries like China and North Korea, possibly pushing the world closer to trade war or worse. The opportunity for traders is this; global fundamentals remain strong, trade wars are unlikely because we all need trade, any price moves based on trade war fears are chances to fade the market.
Fade the market, what does that mean? Fading the market is a highly profitable trading technique in times of higher volatility and/or trading ranges. It assumes that the price movement in question is not good, that it is a false signal and one that is more likely to reverse than to continue in the same direction. In the case of a trading range this means prices have hit the upper or lower band, possibly even moved past them, while no change in fundamentals has occurred. In the case of volatile markets, like we have now with equities, it assumes that price moves are knee-jerk reactions to news, not based on fundamentals, and likely to reverse.
The main difference between the two situations is how you trade them. With a trading range you can fade either the top, or the bottom, or both end of the range whenever prices reach that level. With volatile markets it is best to stick with trend following moves. Of course, there are also times when there is volatility within a trading range and those are the absolute best times to use this technique. If volatility picks up while prices are in a range, you can expect to see wild swings that reach or exceed both range limits within short periods of time (relative to your chart time frame).
What do I mean by volatility? I mean times in which prices make larger than usual price movements and/or reversals. Volatility is often induced by news, either good or bad, and results when the market is highly emotional about a subject, but also divided. The division, a difference of opinion whether prices should move up or down, combined with high emotions means big price moves and big profits for traders who know how to capture them.
Look at the chart below. It is the S&P 500 ETF CFD at IQ Option. It is an open-ended position perfect for trading high volatility markets, just be sure and use some risk management. The market hit a peak in February that sold-off on fear of rising inflation. Volatility entered the market providing several opportunities to fade prices. The first move was the deepest and took the longest, about 2 weeks, to hit bottom. Since then there has been 2 other chances to make trend-following fades and another is setting up right now.

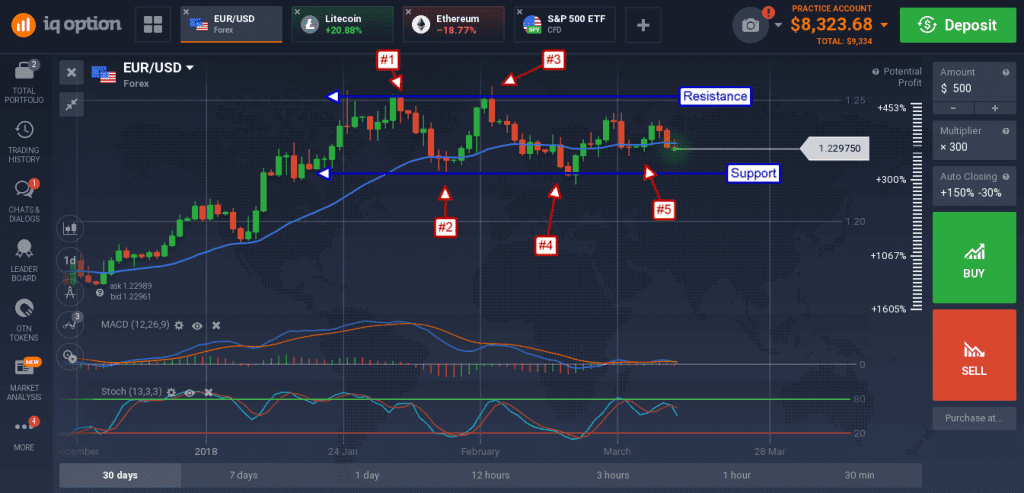
This next chart is the EUR/USD. The pair has been in a trading range for about 2.5 months and presented several opportunities to fade in that time. The first signal comes on confirmation of resistance and sets up the range. The second is when prices bounce from support, delineating the bottom of the range.

Now, any time prices reach those levels, leading up to any expected range-busting catalysts, is a time to fade prices. As the pair approaches the next FOMC meeting the range begins to narrow so candle signals become key.

