
US President Donald Trump made good on promises last week when he authorized new tariffs on imported steel and aluminum. The threat of tariffs had been hanging over the market for more than a week, depressing equities and causing volatility in forex markets, the reality was far from what many pundits had feared. Traders breathed a sigh of relief when Trump’s new trade tariffs were announced. A global trade war is not out of the question but further from reality than it was.
The tariffs target imported steel and aluminum, specifically from countries that do not engage in fair trade practices, but many others may be swept up in the process. The US used to be the world’s leading producer of steel, now it is the world’s leading importer of the product. The tariffs are intended to allow US companies a competitive edge against nations like China who subsidize its workers and overproduces steel. China has long been known to dump steel on the open market, depressing steel prices and otherwise damaging steel industry around the world.
The news that caused traders relief were temporary carve-outs for the US top trading partners. Countries like Canada, Mexico and Australia were immediately included while others like the EU, Japan and England can apply for their own deals. The question now is if the tariffs and temporary status of exemption will influence either Canada or Mexico in their NAFTA negotiations.
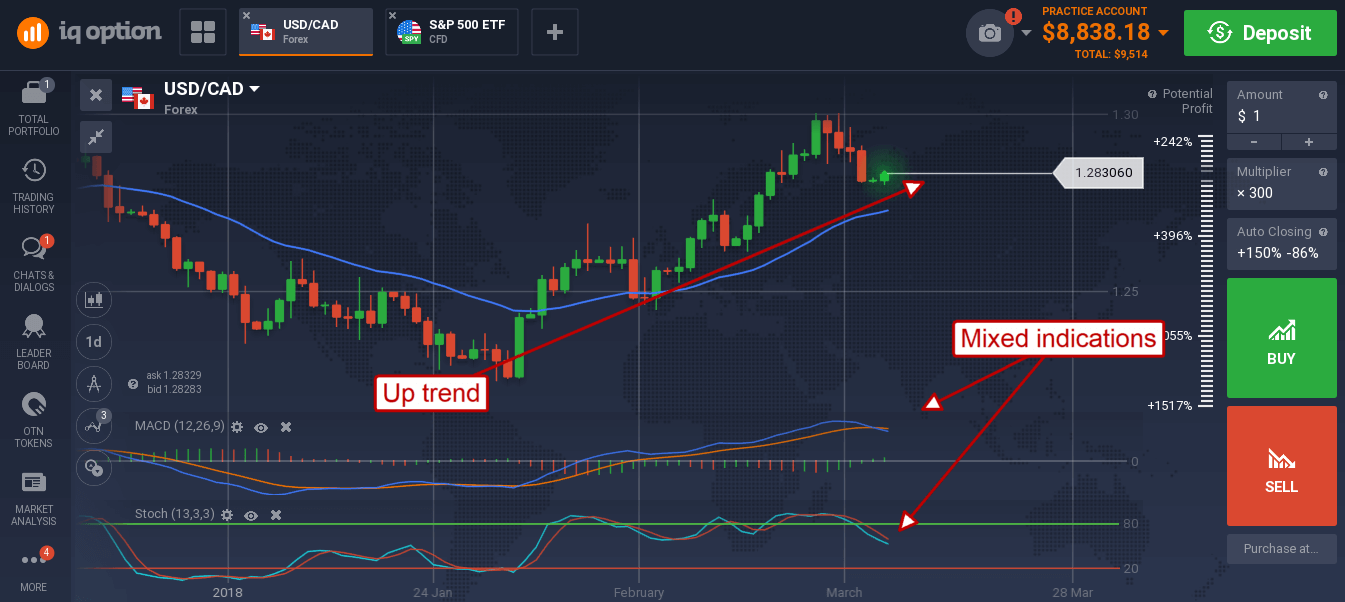
The USD/CAD fell on the news but has found support in the days since. The pair has corrected from its uptrend and now consolidating for the next move. The indicators are a bit mixed but underlying momentum is bullish. A move lower would likely find support at the short term moving average, a break below there may be bearish. A move up, confirming support at the 1.2800 level, would be bullish and trend following. There is not much data due out this week, aside from US CPI, so sideways trading may dominate until the FOMC meeting next week.
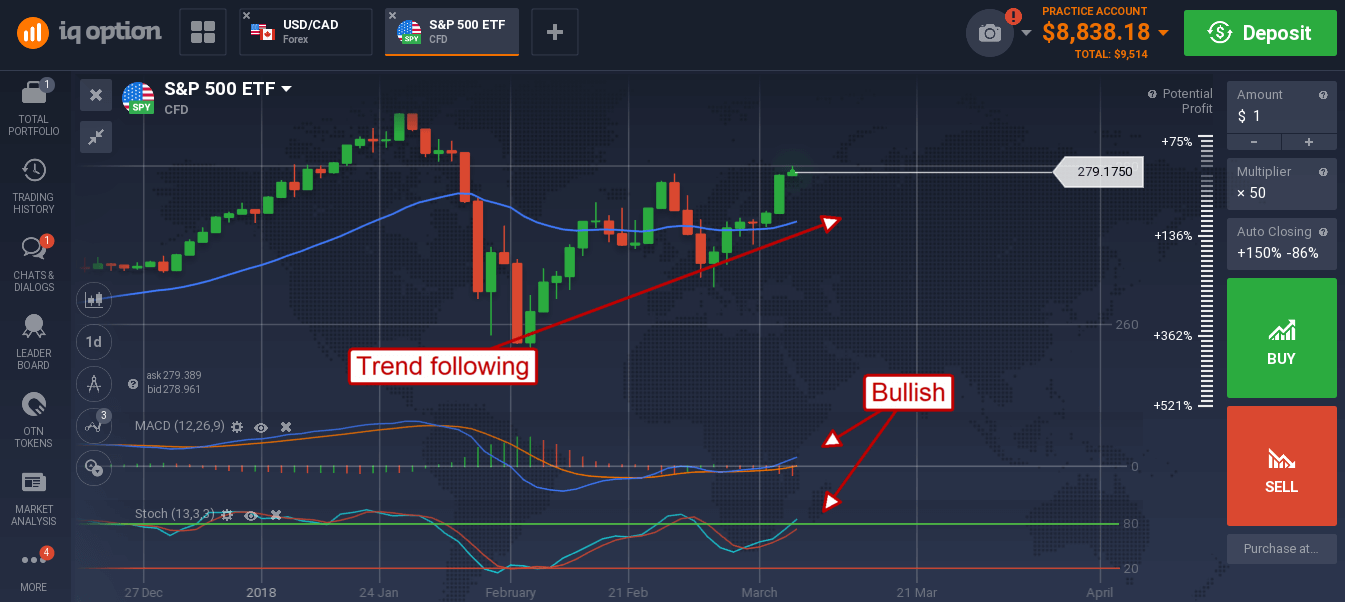
The S&P 500 surged on the news. The move was aided by a Goldilocks NFP report that showed strong gains in jobs and wage inflation well below last month’s market spooking 2.9%. The S&P 500 ETF SPY gained 1.75% on the news and is confirming its uptrend. The recent market correction has developed into a high-probability entry for bullish positions that is supported by the indicators. There is some resistance at the $280 level (2,800 on the S&P 500 index) that may hold prices for a day or two. Once broken a move up to retest the recent highs should be expected.
The EUR/USD continues to trend sideways within its near-term trading range. The long-term indications remain bullish, the question is what will the FOMC do next week and how will the market react. Early Monday saw the pair trade flat from the previous week’s close and on top of the short term moving average.
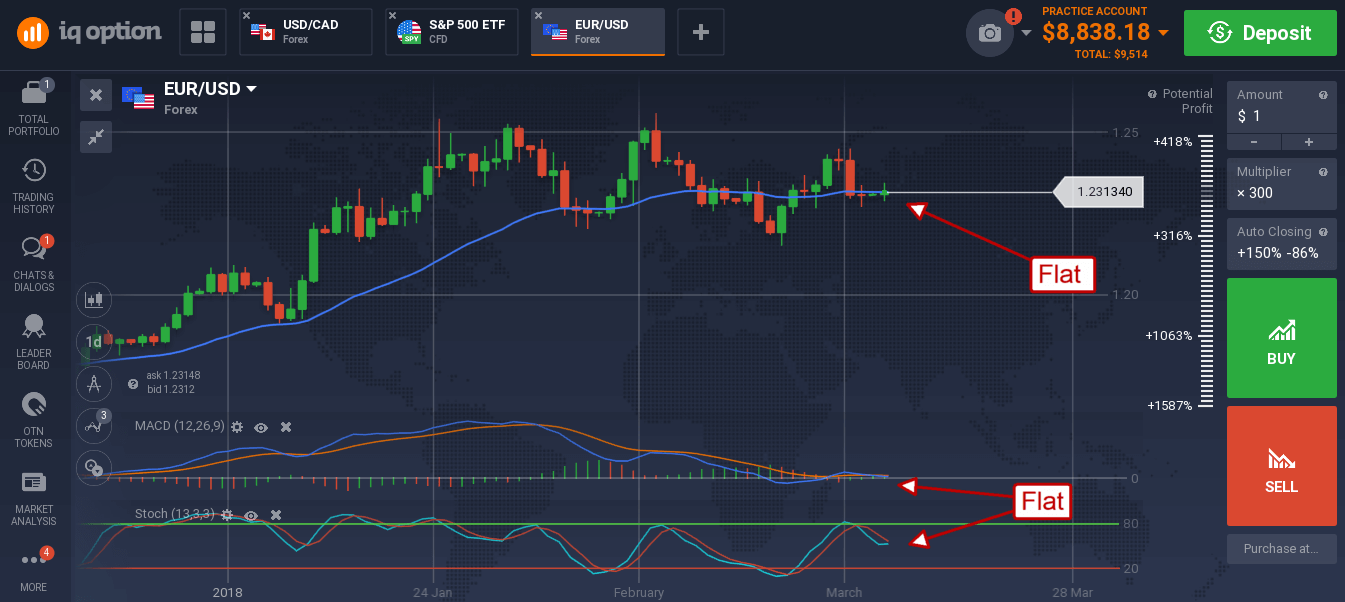
The indicators are both near the mid-points of their ranges and show little movement within the market. This is consistent with a market in wait, and this one is waiting on the FOMC. The CPI may be a market mover, but I think it will have to be a really hot number.
