
Price reversals are a natural part of the way markets flow and learning how to spot them is very important for many reasons. Ignoring a trend shift may increase the risks: the deal opened in a certain direction may go deeper and deeper in loss if the price turns. Let’s see what trend reversals are, how they are formed and how to trade them.
What is a reversal?
A price reversal is a change in its direction. Normally, it is based on the overall price movement and not on a short time period (like 1-2 candles). If the price is moving upwards, a downside reversal may follow. The same way, a downward trend may be followed with an upside reversal.
What is important to remember is that reversals usually refer to larger changes in the price flow, where the price is changing its trend. Smaller price changes are called pullbacks.
The difference is that pullbacks do not turn into a trend – after a short pullback, the price continues to move in the initial direction.
How to spot a trend reversal?
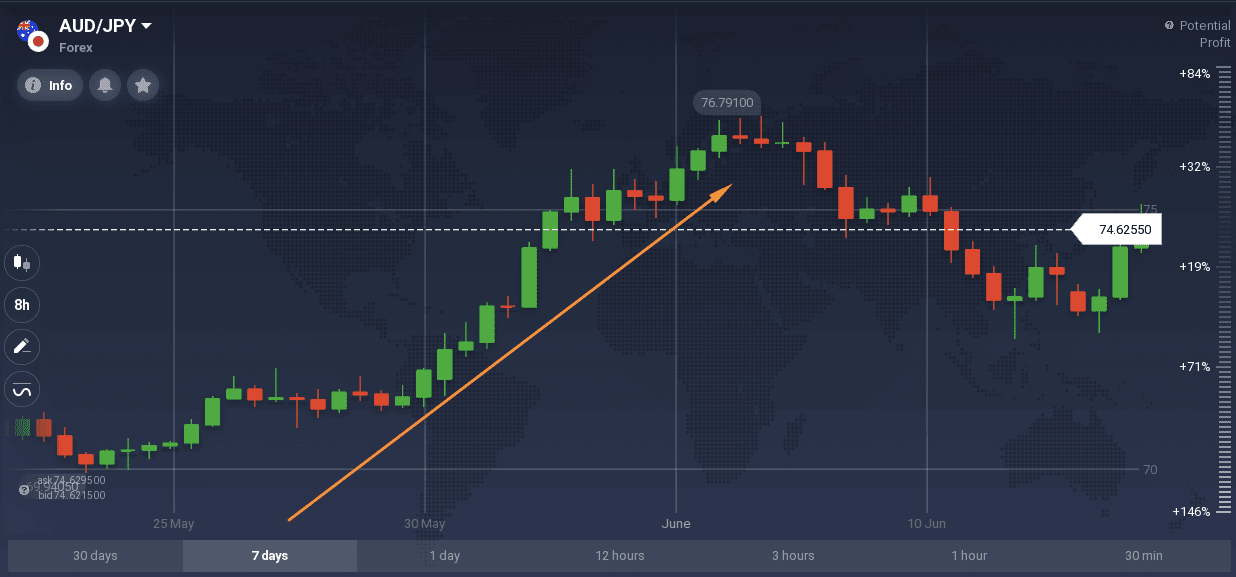
When looking for them, it is necessary to mind the chart timeframe. Different timeframes are relevant to different types of traders – a day trader is more likely to check a 24-hour chart while a 7-day chart might be more valuable for a long-term trader.
On a chart of a larger timeframe (for instance, 7 days), there may be less pullbacks, while on a chart of a shorter time frame (for example, 24 hours), the price might make small movements up and down and change direction many times. However, these changes will not influence the overall price movement from the weekly point of view.
Choosing the trading timeframe and the trading style is important in order to prioritize and plan the steps of a trading strategy. It will allow the trader to decide whether to focus on the pullbacks or the price reversals.
How to trade trend reversals?
Trading the price reversals involves analyzing the market movements and making possible predictions about the future performance.
When the price is starting to turn around, it is hard to tell if it is a price reversal or just a pullback, that is why trend traders, for example, often exit a deal before the reversal happens, in an attempt to manage their losses.
In order to spot a reversal, one may use technical indicators or their combinations. Some useful indicators for this purpose may be oscillators, like Stochastic or RSI. Oscillators determine the overbought and oversold levels of the asset and, normally, it is considered that when the price approaches one of those levels, it changes its direction.
Oscillators may be combined with trend indicators, like Moving Averages or Parabolic SAR. Another useful indicator is the Ichimoku Cloud. One of its main purposes is determining the reversal points on a chart, so it may be used in a trading strategy on its own or with other indicators.
The IQ Option trading platform also provides multiple graphical tools like trends lines and the Fibonacci retracement, that may also be used to measure how far a pullback could go.
Conclusion
Finding trend reversals is very important for a trader and there are many tools that can be used for that. Now that you understand how to recognize them, you may try to apply this knowledge in your daily trading.