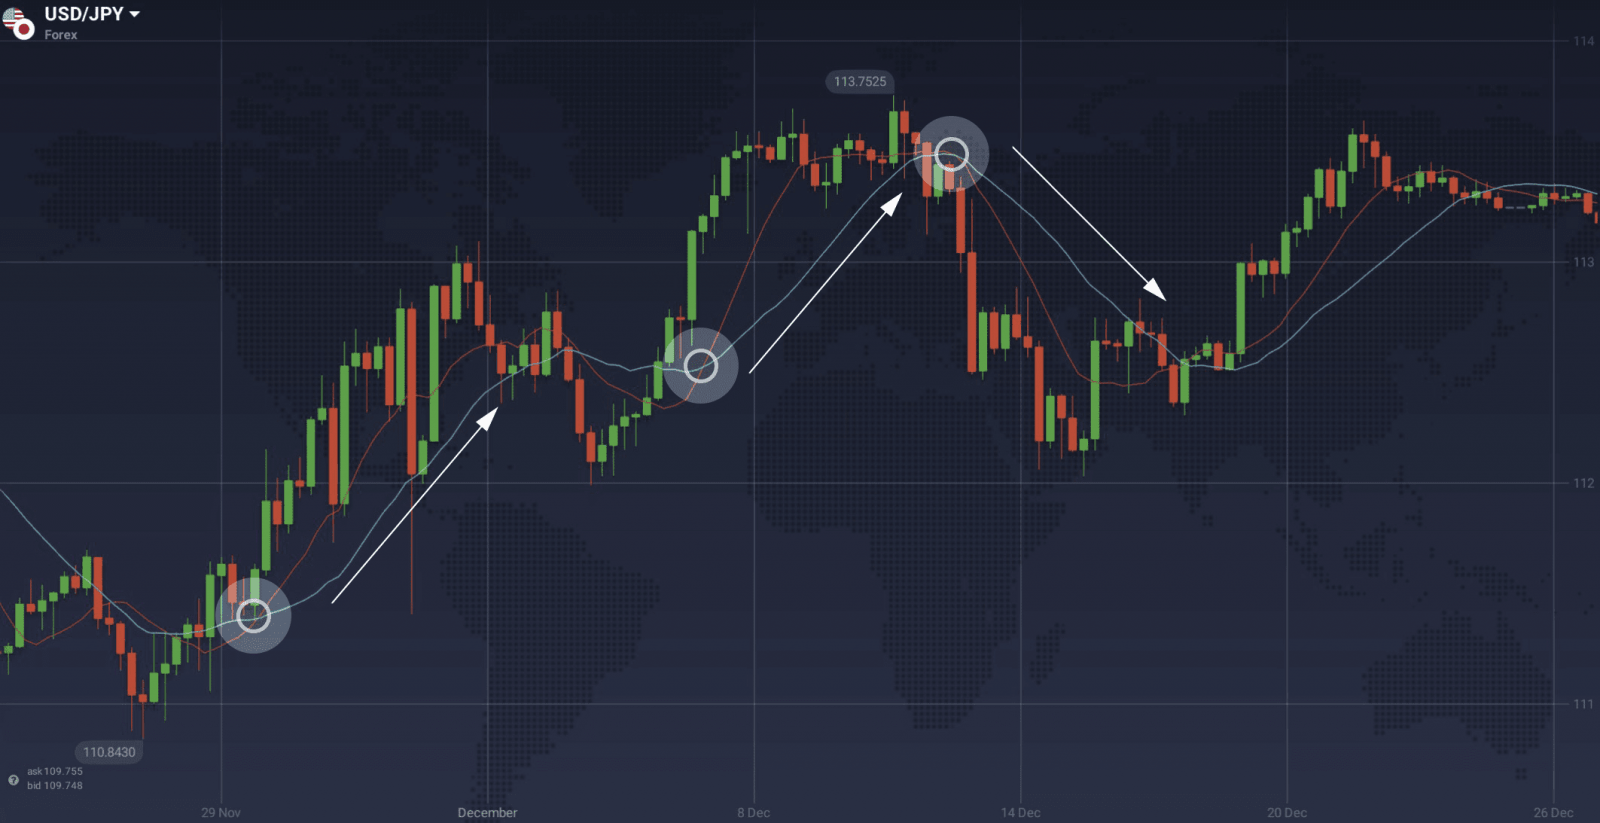
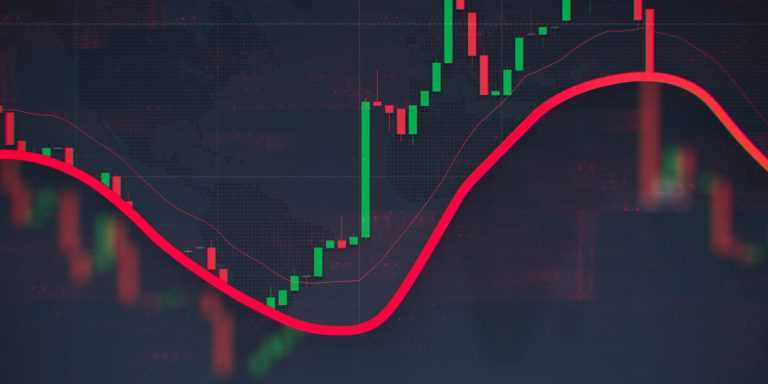
A Moving Average is a technical analysis indicator that is good at determining the trend strength and direction. The steeper the line, the stronger is the prevailing trend and vice versa. A not so steep moving average is an indication of a weaker trend. An upward curve corresponds to a bullish (positive) trend, a downward — to a bullish (negative) one.
But isn’t it easier to tell the trend strength and direction by looking at the chart itself? It can be but only if you are using a linear or an area chart. In case of a candle/bar chart, the prevailing trend is not always obvious, especially around the turning points. The use of a moving average can be a good starting point of your technical analysis efforts.

Spot a trend reversal
Technical analysis adherents know that moving average crossovers can be used as a signal for an upcoming trend reversal. Crossover is a point where two different moving averages meet one another. Right, one moving average is not enough to predict the change in the trend direction (although it will indicate it post factum). Two moving averages with different periods (say, 10 and 20) are used for this purpose. Due to the discrepancy in periods, the two lines will be crossing one another each time the trend changes its direction. That’s the basic principle behind this instrument.

Set up and apply
This is how to set up the indicator when trading on the IQ Option platform:
- Click on the ‘Indicators’ button in the bottom left corner of the trade room.
- Go to the ‘Moving Averages’ tab,
- Choose Moving Average from the list of available indicators,
- Set the required period,
- Repeat the whole procedure for the second line but change its period.
The difference in periods is supposed to be big enough. Otherwise the instruments will not be working as intended. You may also want to change the line color to distinguish between the lines.
Please note
Be prepared that a combination of two moving averages will most certainly be lagging behind the price action. It is, therefore, wise to use it on longer time frames, as short-term fluctuations are quite likely to provide signals when the trading opportunity is already gone.
Changing the period will either make the indicator more sensitive (at the same time increasing the number of false signals) or decrease the number of false alarms (by also decreasing the number of signals in general). Anyway, every trader has to adjust the indicator to his liking and his personal trading style. Please note that no indicator, including all types of moving averages, is capable of providing accurate signals 100% of the time.

