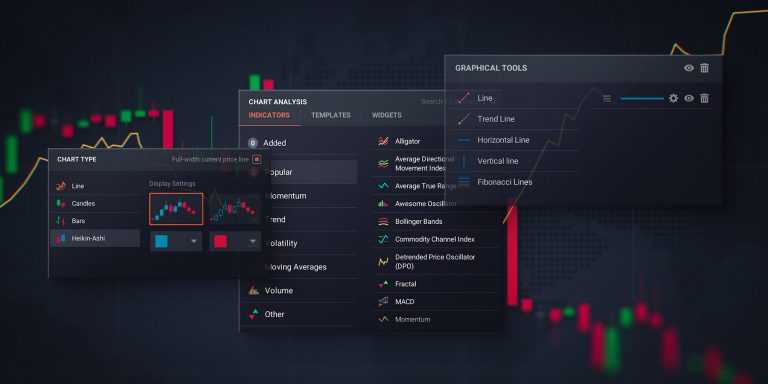
When you start a task, one of the first things to do is to prepare the tools you will be needing to accomplish it. For example, if you are painting, you think about the brushes, paints and paper that you will require. If you are traveling, you think about the means of transportation, your route and accommodation. If you are starting a business, you think about your capital and the staff you will need to hire. Such tools are necessary to help you carry out your idea.
Similar to this, when it comes to trading, utilizing certain tools may be essential, as it gives you the capability to come closer to your potential goal. Trading tools can be the technical instruments that help you analyze the chart, but they can also be the platform settings that allow you to customize the traderoom to your own taste. Here are some of the tools that you can find on the platform and may use every time you trade. Hopefully, they will make your trading routine a bit more organized.
Chart types
The first and most basic setting that can serve as a useful trading tool is the chart type. There are 4 different chart types to choose from on the IQ Option platform. The default type is the Linear chart, which displays price changes in one simple line. It could be easy to track, but it does not show detailed information like the opening, closing, high and low prices.
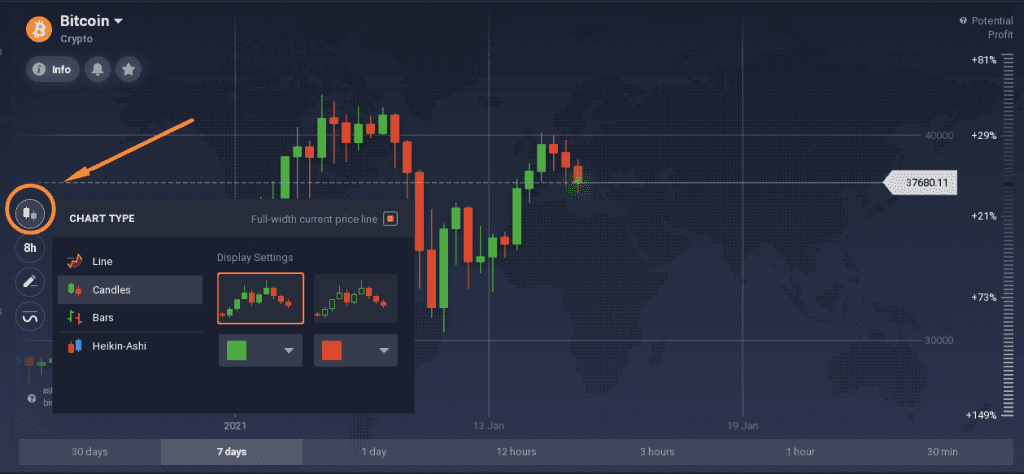
Candles and bars, on the other hand, display more information about the asset price over time. And Heikin-Ashi is an alternative to classic candlesticks, serves as both a chart type and an indicator, since it displays a smoothed version of the price sequence and might help a trader to determine the trend direction better.
The display you choose depends solely on your trading approach: do you prefer seeing all the details of the price changes for a certain period, or do you focus on larger scales and just need one line to show it? You may try all of the types to decide which one works best for you.
Indicators
Just as any trader, you most likely wish to know what is going to happen to the market next. Will the price grow or fall? This is where technical analysis comes in.
While there is no way to predict the market movements with a 100% guarantee, there are ways to evaluate the performance of the asset and decide on the possible outcome. For this, technical indicators are used. Assuming that price movements are not completely random, many traders use combinations of indicators to analyze the chart.
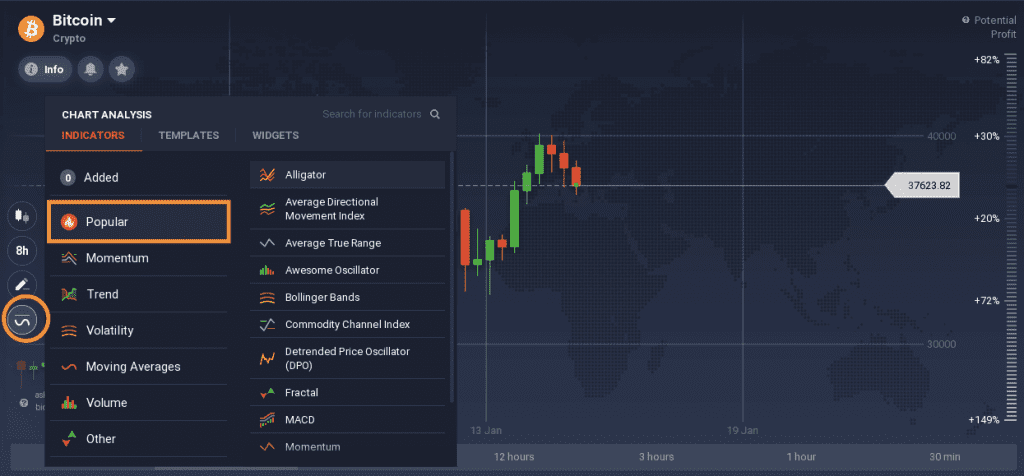
In order to start implementing technical analysis in your trading, begin with the Practice balance and the indicators from the “Popular” section. Experienced traders rarely use just one indicator, as the signals might be false sometimes. Combining trend indicators with oscillators and not using more than 2-3 indicators at once might be a good approach.
Graphical tools
Besides indicators, a way to analyze the price chart is to implement graphical tools. At the moment, on the IQ Option platform, it is possible to use a simple Line, a Trend line, a Horizontal or Vertical line as well as the Fibonacci retracement.
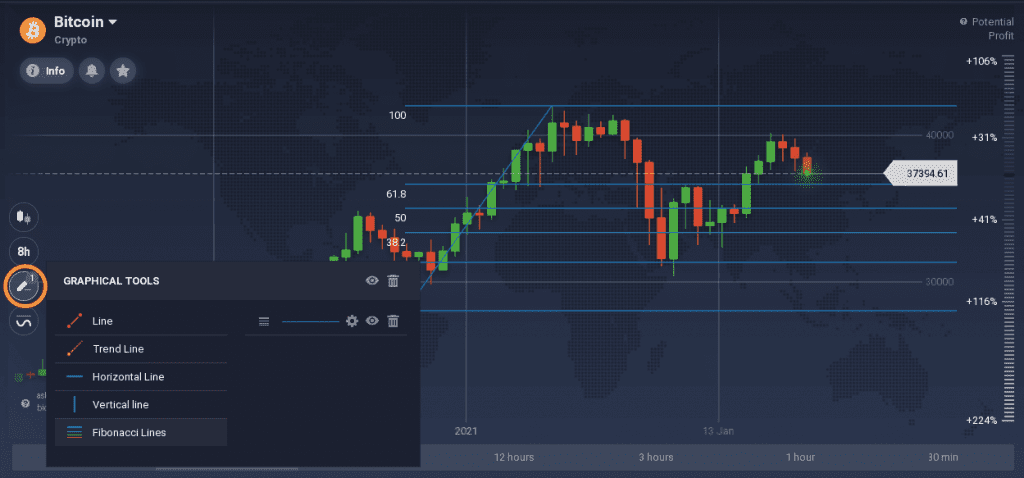
These graphical tools can be used to draw all kinds of essential levels on the chart. You may set the support and resistance levels, mark breakouts or simply draw chart patterns when you find them — Diamond, Triangle, Head and Shoulders and so on.
You can use these lines as you want, they allow you to be more creative and transfer your thoughts directly to the screen. And if something goes wrong — you can easily delete them and start over.
Traderoom settings
One more way to control your trading and make it more convenient for you is to check the settings tab. It may seem quite obvious, but many traders overlook the settings and discover some options too late.
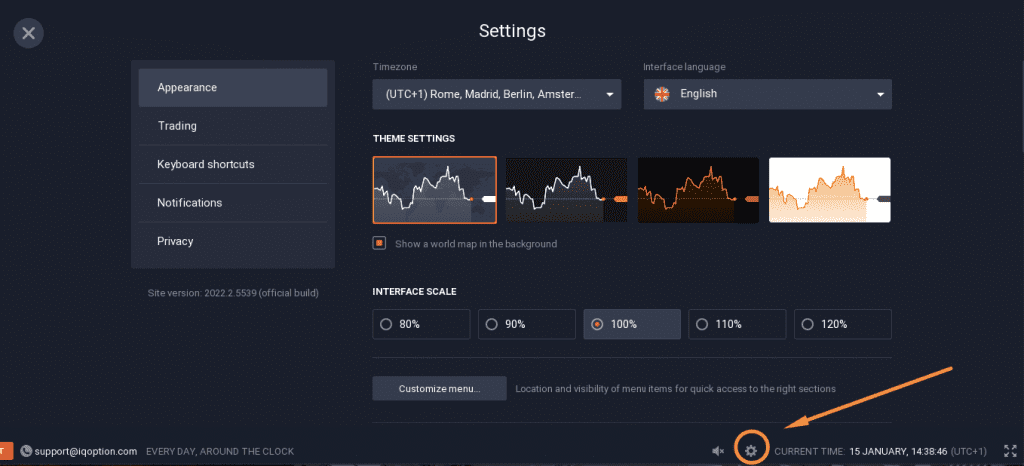
For instance, you may change the appearance of the traderoom according to your preference — you can utilize a different color scheme, choose the interface scale, and choose the information you wish to see on the chart. In “Trading” settings you can manage the way you want your deals to be opened or closed: with or without a confirmation. You are able to adjust the notification preferences, the language, the timezone — many minor things that altogether add up to a more personalized and convenient traderoom.
Overall, there are many tools that can add to your daily trading routine. Of course, mastering them all takes time, but that is why a Practice balance is available for you in the traderoom. You can test out different tool combinations and settings in order to find what works best for you.
