
Trading candlestick patterns is one of the first things that novice traders learn. Patterns are relatively uncomplicated to understand and finding them on the charts may be a more accessible task than learning about technical indicators. Though no pattern can give a 100% guarantee, some of them are easier to find and show better performance than others.
Today we will look at one of the more popular patterns called “the flag”. As most patterns, it received its name due to the shape it forms on the chart. It is a reversal pattern that is formed with two parallel lines (support and resistance). The flag is represented in a strong trending move, followed by a weak pullback. Let’s have a closer look at how it works.
How to find the flag pattern?
This pattern usually appears after a strong trending move. The flag itself is a short-term pullback. For upward breakouts, the asset is trending up and the flag continuation is downward, followed by an upward breakout.
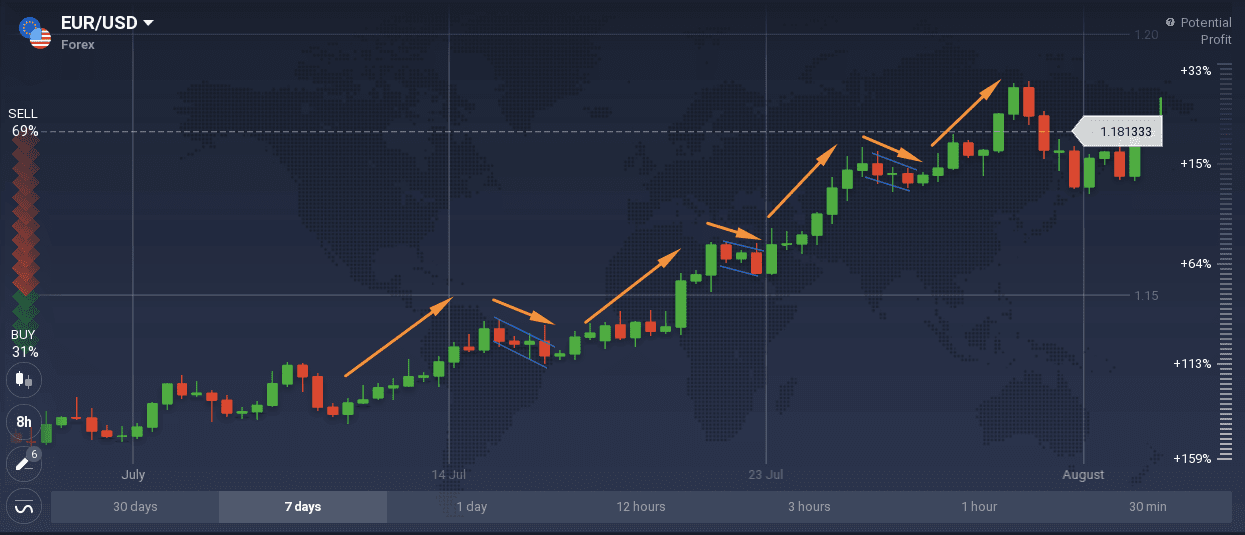
In the example, the EUR/USD is rising up, then the price pauses at the flag and continues to rise with an upward breakout of the flag. The confirmation for the pattern is received when the price breaks through the previous high. The example shows how multiple flags may be formed during a strong upward trend. In this case, catching the first flag formation is optimal.
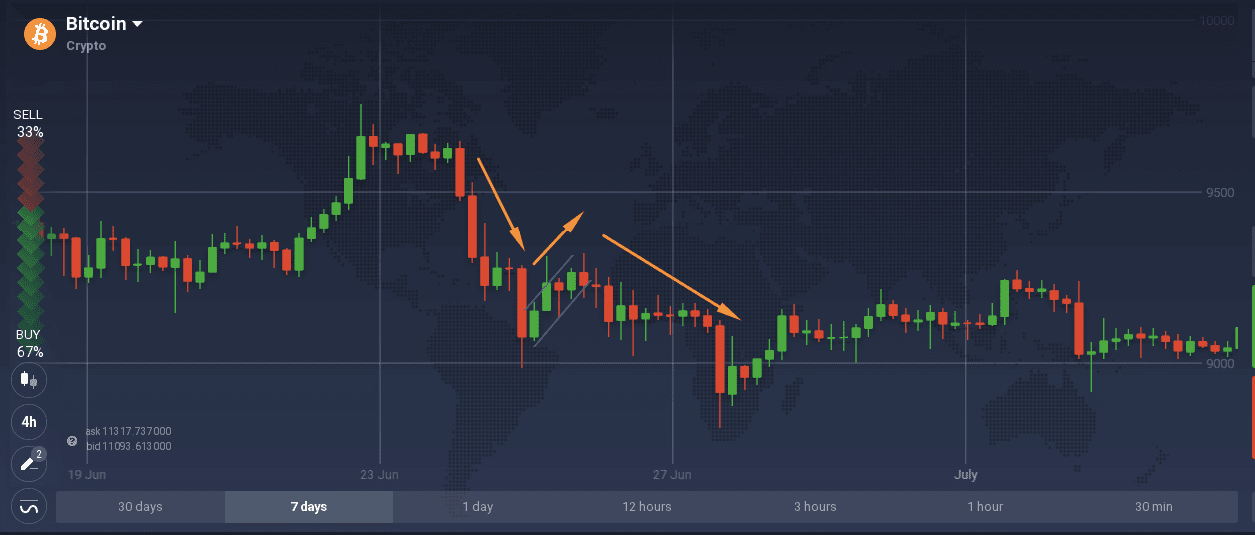
For a downward breakout, the price follows a downtrend, the flag continuation is upward after which the price keeps falling.
It has been noted that long and wide flags perform better than short and narrow ones. However, sometimes flags that are too long may continue with the price going in the same direction, instead of a price reversal. A trader needs to be careful to make sure that the price broke through the flag in the direction it was following before the flag formation.
When to trade the flag pattern?
A flag pattern may be traded after a breakout of the price. For instance, once the price breaks through the support or resistance levels and the first flag (pullback) is formed, traders may consider entering the deal and also placing a stop loss level to manage the losses in case of a wrong signal. This might allow a trader to potentially “ride” a longer trend (the first example shows such a possibility). Another situation in which the flag pattern may be found, for example, is during a strong trending market.
Each trader can decide on the exit points according to their strategy. However, it is important to note that traders may consider using a trailing stop loss in order to exit the deal before losses cannot be manageable.
Conclusion
To some traders, the flag formation may become a go-to pattern. However, as with any analysis tool, it is best to try it out on the practice account before investing real funds. Do you use any candlestick patterns in your trading approach? Let us know about your favorite ones in the comments below!
