Trading patterns are bread and butter of most Forex traders and there is no surprise that reversal patterns play an especially important role in trading, as they help to determine optimal entry and exit points. This is how to spot and use price reversal in trading.
Why is it important?
Trading patterns are recognizable, repeatable, predictable price movements that traders can use to pinpoint entries and exits alike. Trading patterns can help you a great deal if identified correct. The problem is they (really good ones) don’t form all that often and when they do they usually don’t look like what you see in the textbooks.
What to look for?
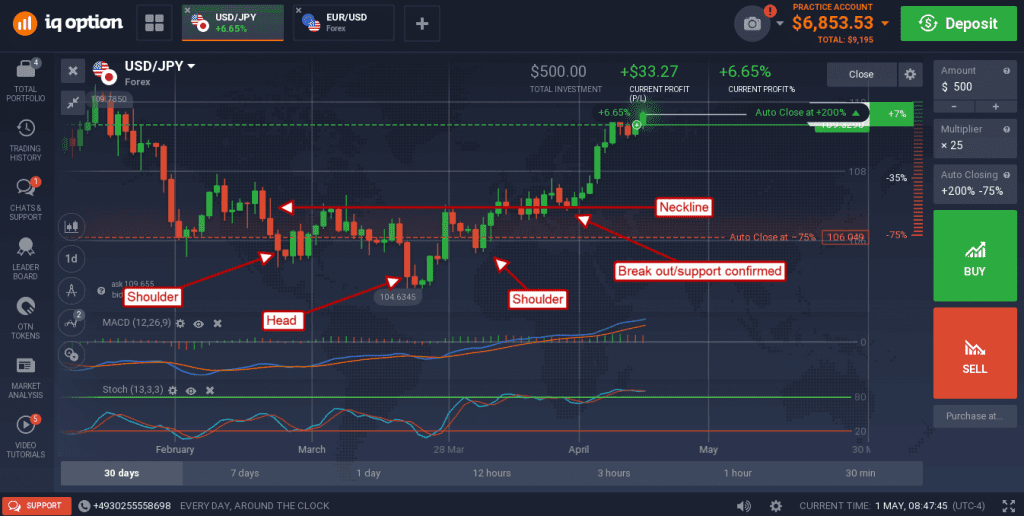
In the example below, the USD/JPY has demonstrated a reversal. The pair has formed a classic head & shoulders bottom and confirmed reversal with a break above the neckline. A head & shoulders bottom, or top, is one of the most commonly observed patterns consisting of three successive lows, or highs, in which the second is lower than the first and the third is higher than the second. These lows can typically be strung together by the peaks that form between them forming a pivot point/resistance level known as the neckline.
Patterns such as this can form within a sideways trading range, so caution is advised, a break above the neckline followed by a confirmation of new-support at the neckline is required to confirm reversal in prices. That is, to confirm that price action has begun to move up.

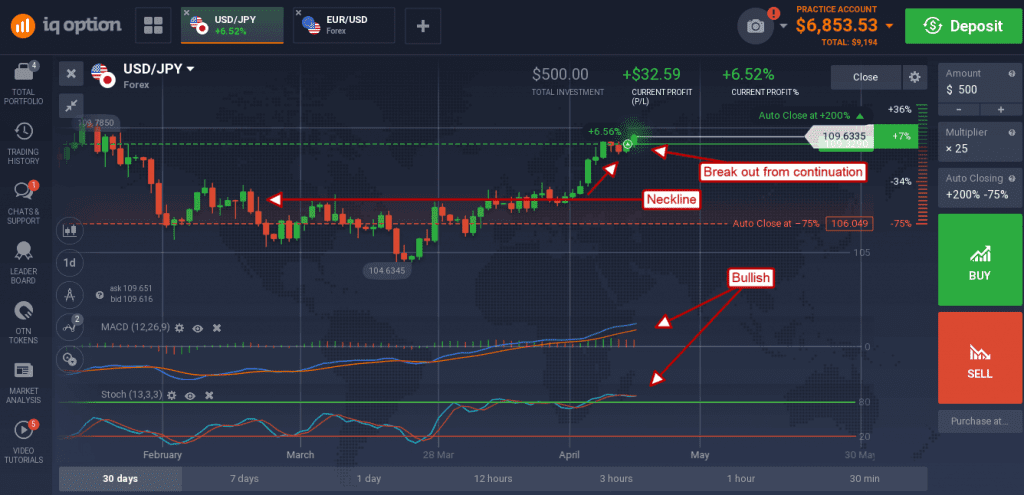
Once confirmation occurs it is possible to project a target exit by using the magnitude of the pattern. In this case the lowest low, the head, is at 104.16 so subtract that from the neckline, 107.00 and get 2.84. This means traders can expect to see the pair move at least 2.8400 in the first rally from support. Support is at the neckline which means 107.00 + 2.84 = 109.84. You can see in the chart that the pair has indeed moved up to that level and is fast approaching the resistance target. At this time, it may be prudent for traders already in the trade to take some profits, but the rally is not over.

The first rally from support took a pause just above 109.00. This pause resulted in a continuation pattern which suggests this first move up is only half over. Projecting the magnitude of the first leg, about 002.00, suggests the rally will move up to 111.00 in the near term. Looking at the price history we can confirm the 111.00 as a possible resistance target. This target, now that price action has broken out of its consolidation/continuation pattern, is likely to be hit in the next few days.
What’s behind this move? The BoJ struck a hawkish note two weeks prior to observed events, thus sparking a reversal. The FOMC was about to tighten at least two more times this year, maybe three, and was holding a policy meeting at the time. Their statement, released Wednesday afternoon, could have been the trigger that drew the pair up to 111.00 and possibly higher.

