
When it comes to technical analysis, there is a lot to learn: the different types of indicators, how they function, how to apply them to the chart and read their signals. On top of that, traders may encounter a lot of new terms associated with this topic. Today we will be looking at 4 terms that are commonly used when talking about technical indicators.
Leading indicators
In economics, this term refers to the factors that shift before the economy starts going in a certain direction. Such factors go ahead of the actual events, trying to predict the future. When it comes to technical indicators, leading indicators give out a signal about changes on the market before the price movement actually occurs. Examples of such indicators are RSI, Stochastic, ADX and other oscillators.
Using leading indicators is helpful, as it gives a trader the opportunity to see where the market is generally headed. However, these indicators are not 100% accurate and it may so happen that the indicator is giving out a wrong signal. Experienced traders combine leading indicators with other tools for better outcomes.
Lagging indicators
Lagging technical indicators base their signals on the past events, reflecting the past performance of an asset. Such indicators do not show any upcoming movements, but they confirm the current direction of the price. Lagging indicators are combined with the leading ones, as on their own they may not be enough for a complex chart analysis. The disadvantage of such indicators is their slower reaction to the market: the signals may not always be timely.
Examples of lagging indicators are such trend-following indicators as MACD, Fractals and Bollinger Bands.
Period
In the settings of indicators, no matter which one you may be using, there will always be a Period setting. What is it? Period means the amount of candles used for calculation. For instance, if a trader is using a candle chart with each candle representing 1 hour, then the period of the indicator will be calculated in hours, with precisely the amount of them that a trader indicates.
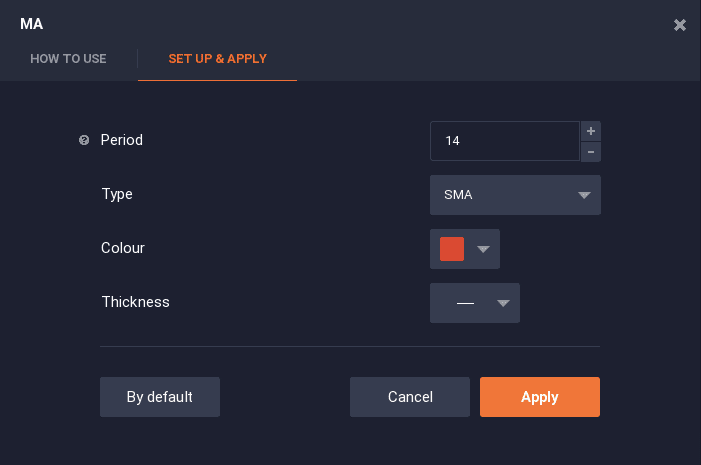
Here is an example of SMA settings. The default period for this indicator is 14, which means that the last 14 candlesticks or bars will be taken into calculation. The candles themselves can be set to different timeframes, depending on a trader’s strategy (short timeframes or long ones).
Divergence
Though indicators may form useful strategies and be a convenient analysis tool, sometimes they give out wrong signals. When an indicator shows different information from the price chart, it is called divergence. It can be positive or negative, with the indicator showing a higher or lower value than the actual asset. Divergence can be an indication that the current trend is weakening and will change soon, however, using divergence as a signal on its own is quite risky. Divergence can last a long time and it does not happen very often. It takes a lot of practice to learn using it as an analysis tool.
What other terms do you wish us to explain? Share your suggestions in the comments and they will be covered in the next articles on our blog.
