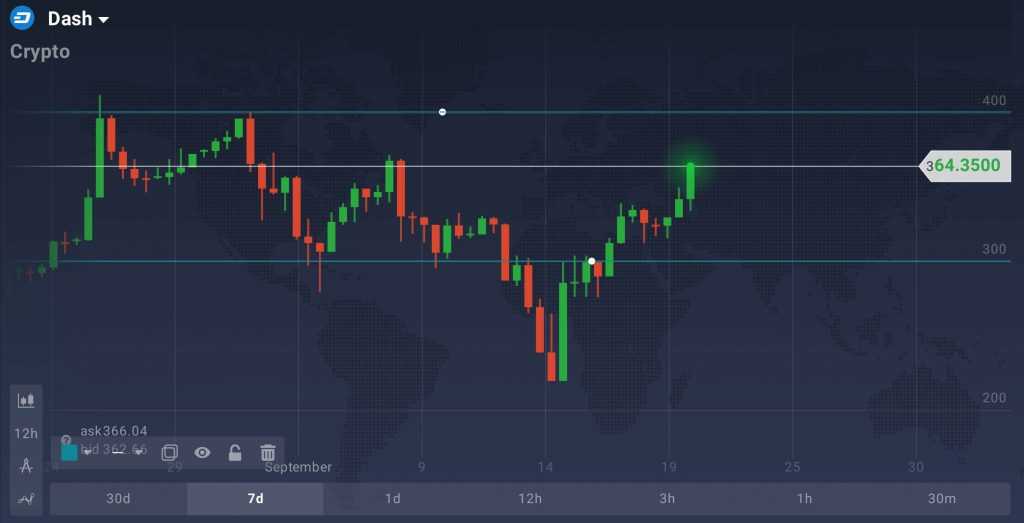
On the 1st of September, with the cryptocurrency market booming, Dash was traded at around $400. The price action, however, did not pass the test and soon reverted to $329, then to $280, finally falling as low as $221 in a series of huge negative leaps. What seemed to be an ultimate downfall of Dash (and the cryptocurrency market in general) ended in a matter of two days, when it became clear the coin is back to growth.

Now, the price action is heading to the $400 level, which can once again act as a horizontal resistance line. As always in cryptocurrency trading, round numbers play an extremely important role in determining overbought and oversold positions. Should the Dash price break through the $400 mark is yet to be seen. However, technical analysis tools determine the uptrend as an obvious reality. According to the behavior of the price, the most recent surge, initiated on September 14th, is not merely a retracement. The positive trend has dominated the price chart for seven days already.
While the cryptocurrency market remains tranquil and slowly consolidates, several outliers demonstrate anomalous activity, losing and gaining in double-digits. Dash, for example, retrieved a substantial portion of its lost value, surging from $220 to $364 (or 65 percent) in only one week.

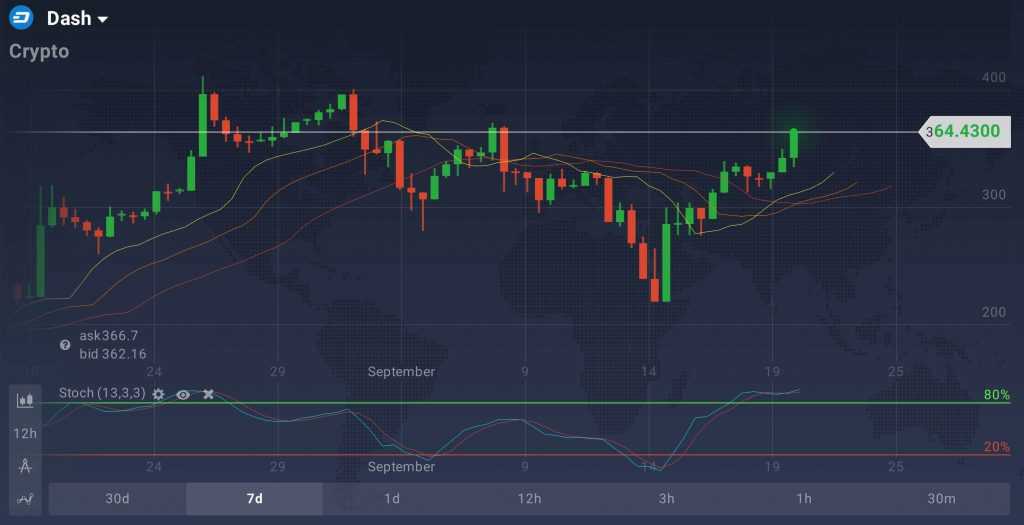
According to the technical analysis tool called Alligator, Dash demonstrates positive short, medium and long-term dynamics. Stochastic Oscillator (a momentum indicator that determines overbought and oversold positions) allocates the current price to the overbought zone, signaling strong upward movement.

