


Technical analysis indicators are very helpful in allowing traders to better understand the conditions surrounding the markets. These are tools that can be used in decision-making but should not in any way be followed instinctively. Indicators should help a trader in understanding trends, momentum, volatility, and risk.
This guide explains the most useful technical indicators every trader should understand. The focus is on simplicity, practical use, and avoiding common mistakes.
What Are Technical Analysis Indicators
Technical analysis indicators would include calculations carried out on the prices and/or volumes. The indicators make raw market data interpretable in forming graphical signals. These signals assist in forming an opinion on the market trends.
Indicators are usually classified into two types. These are leading and lagging indicators. While the former try to foresee the movements, the latter verify the movements that are already happening. Both are useful when applied to the proper context.
Indicators do not substitute price analysis. Indicators can be most effectively integrated together with market structure concepts of support and resistance and risk rules.
Why Indicators Matter in Trading
Indicators help traders add structure to market analysis by turning price movement into measurable data. This reduces guesswork and supports more consistent decisions.
They are especially useful when integrated into a clear trading plan. Instead of reacting emotionally, traders rely on objective reference points.
Key benefits of using technical indicators include:
- Trend identification to determine market direction and bias
- Momentum confirmation to assess the strength of price moves
- Volatility awareness to adapt position size and stop placement
- Timing support for entries and exits
- Risk management guidance through clearer market structure
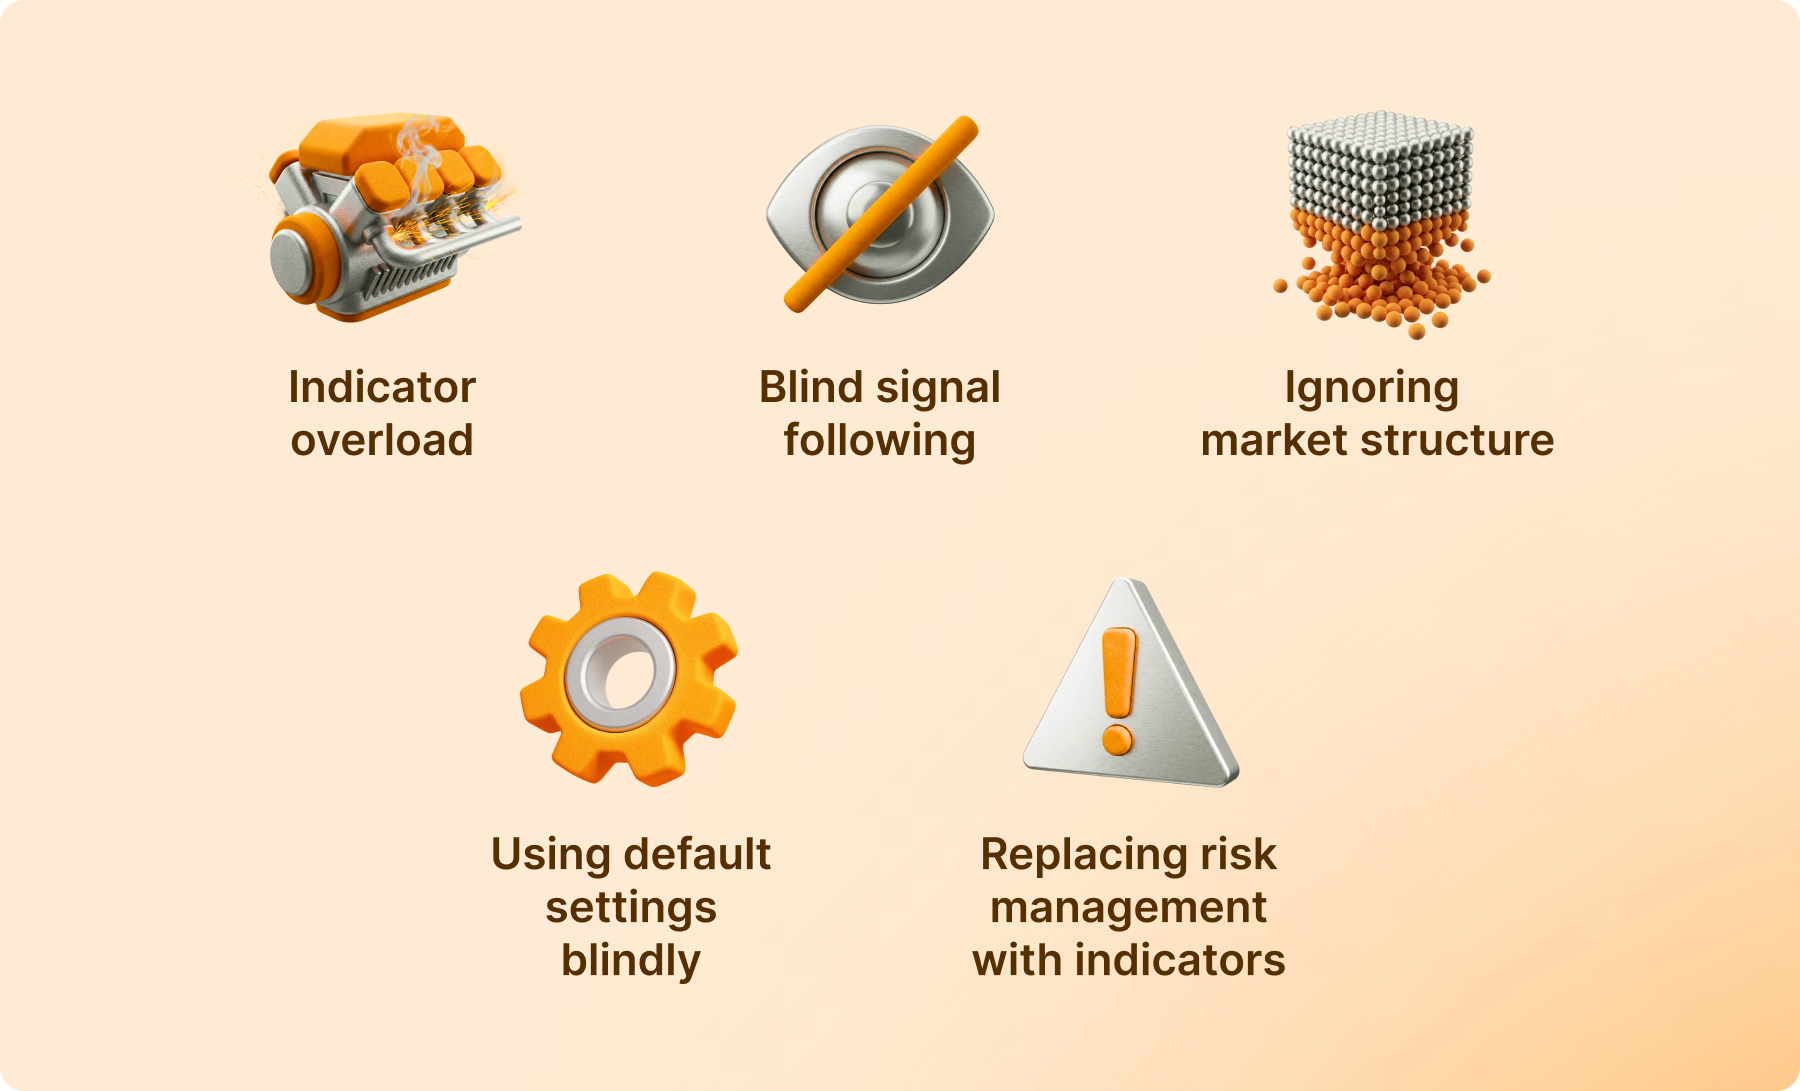
Common Mistakes When Using Indicators
Indicators are often misunderstood and misused, especially by beginners. These mistakes reduce effectiveness and increase confusion instead of clarity.
- Indicator overload. Using too many indicators creates conflicting signals and analysis paralysis. Simpler setups improve focus and execution.
- Blind signal following. Taking trades based only on indicator signals without price context leads to late or low quality entries.
- Ignoring market structure. Indicators behave differently in trends and ranges. Without identifying structure, signals lose reliability.
- Using default settings blindly. Default parameters may not suit all markets or timeframes. Settings should align with trading style and volatility.
- Replacing risk management with indicators. Indicators do not control risk. Stop losses, position sizing, and exposure limits remain essential.
Trend Indicators Every Trader Should Know
Trend indicators help traders define market direction and avoid trading against the dominant move. They are most useful when the market is trending, because signals become unreliable in choppy ranges. The goal is not to predict the next candle. The goal is to align trades with the broader direction and improve timing on pullbacks and breakouts.
If you want clean execution, treat trend indicators as confirmation tools. First identify structure on the chart, then use the indicator to validate bias. This keeps decisions consistent and reduces conflicting signals.
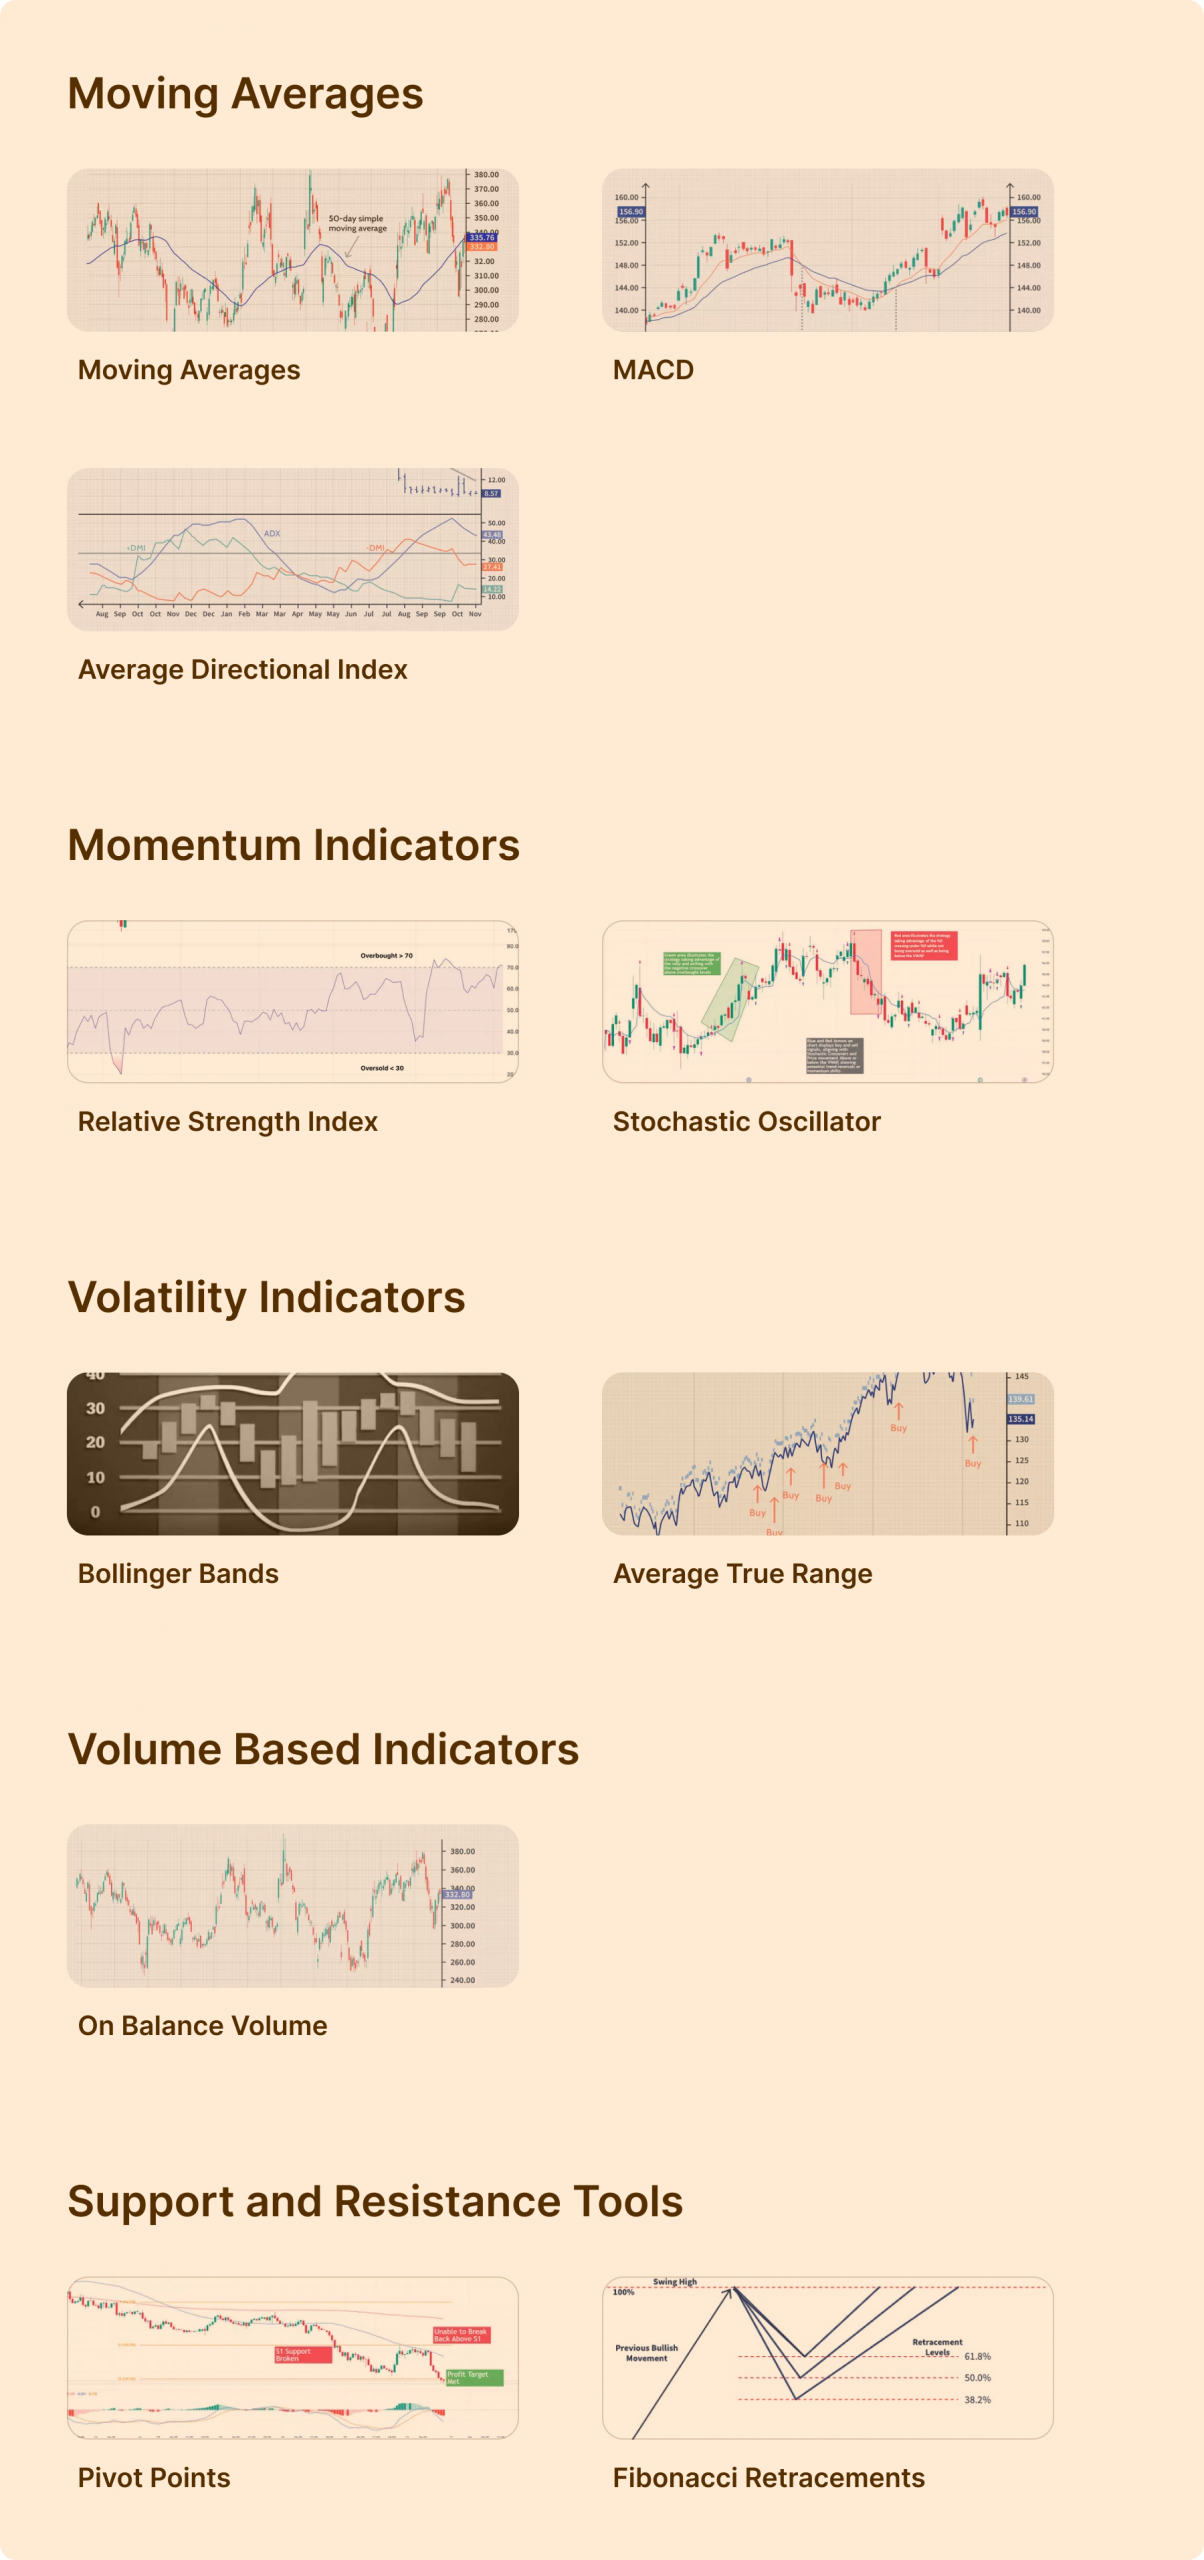
Moving Averages
Moving averages are among the most widely used trend indicators. They smooth price data to reveal the underlying market direction. This helps traders filter noise and focus on structure.
Simple moving averages calculate an average price over a fixed period. Exponential moving averages give more weight to recent data. This makes them react faster to price changes. Shorter periods respond quickly. Longer periods define the broader trend.
Moving averages are often used to define bias and dynamic support or resistance. Price above a rising moving average suggests bullish conditions. Price below a falling moving average suggests bearish conditions. They work best when combined with clear market structure and risk rules.
MACD
The MACD is a momentum based trend indicator. It measures the relationship between two moving averages and shows how momentum changes within an existing trend. This makes it useful for confirmation rather than prediction.
The indicator consists of the MACD line, the signal line, and a histogram. Crossovers between the MACD line and the signal line can highlight momentum shifts. The histogram shows the strength of that momentum visually.
MACD works best when the market already has structure. In strong trends, it helps confirm pullbacks and continuation moves. In ranging markets, signals become less reliable and should be filtered with price action.
Average Directional Index
The Average Directional Index measures trend strength. It does not show direction. It shows whether a market is trending or ranging.
A rising ADX value signals strengthening trend conditions. A low ADX value suggests consolidation and weak momentum. This helps traders avoid using trend strategies in unsuitable markets.
ADX is best used as a filter. When ADX is low, trend based entries should be avoided. When ADX rises, trend continuation setups become more reliable. It improves trade selection and reduces low probability trades.
Momentum Indicators
Momentum indicators help traders measure the speed and strength of price movement. They do not define direction on their own. They show whether a move has energy behind it or is losing strength.
These indicators are especially useful for timing entries and exits. They help identify exhaustion, continuation, and divergence. Momentum tools work best when aligned with trend and structure.
Relative Strength Index
The Relative Strength Index measures the strength of recent price movements on a fixed scale. It helps traders identify overbought and oversold conditions, as well as momentum shifts.
High RSI values suggest strong bullish momentum. Low values suggest strong bearish momentum. In trending markets, RSI often stays elevated or depressed for long periods. This is normal and should not be treated as an automatic reversal signal.
RSI is most effective when used for divergence and trend confirmation. Bullish divergence can signal weakening downside momentum. Bearish divergence can warn of fading upside strength.
Stochastic Oscillator
The Stochastic Oscillator compares the closing price to a recent price range. It helps measure momentum and identify potential turning points. The indicator moves between fixed upper and lower levels.
In ranging markets, the Stochastic Oscillator is especially useful. Readings near the upper level suggest slowing upside momentum. Readings near the lower level suggest slowing downside momentum. This helps time entries near range extremes.
In strong trends, the indicator should be used carefully. It can stay overbought or oversold for long periods. The best use is confirmation, not reversal prediction. Align signals with structure and trend for better results.
Volatility Indicators
Volatility indicators measure how much price moves, not where it will go. They help traders adapt to changing market conditions. High volatility requires wider stops and smaller size. Low volatility allows tighter risk control.
These indicators improve risk management and timing. They are not directional tools. They support decision making around entries, exits, and position sizing.
Bollinger Bands
Bollinger Bands expand and contract based on volatility. When bands widen, volatility is increasing. When bands tighten, volatility is decreasing.
Price near the upper band shows strong momentum. Price near the lower band shows downside pressure. In ranges, bands help identify extremes. In trends, price can ride the band for extended periods.
Bollinger Bands are useful for spotting volatility squeezes. A tight band phase often precedes a strong breakout. Direction should always be confirmed with structure.
Average True Range
Average True Range measures average price movement over a set period. It does not indicate direction. It shows how active the market is.
ATR is widely used for stop loss placement. Wider ATR values suggest the need for larger stops. Lower ATR values allow tighter risk control.
ATR also supports position sizing. More volatile markets require smaller size. This keeps risk consistent across different instruments and conditions.
Volume Based Indicators
Volume indicators show how much market participation supports a price move. Price can move without conviction, but volume reveals whether buyers or sellers are truly committed. This makes volume a critical confirmation tool.
Volume indicators work best alongside price action. They do not predict direction. They validate strength, weakness, and potential continuation.
Volume
Raw volume shows how many units were traded during a specific period. Rising volume during a breakout suggests strong participation and higher continuation probability. Falling volume during a move can signal weakness.
Volume is especially useful at key levels. Breakouts with low volume often fail. Pullbacks on declining volume usually indicate healthy corrections rather than reversals.
Volume should always be compared relative to recent activity. Absolute numbers matter less than change and context.
On Balance Volume
On Balance Volume tracks cumulative volume based on price direction. It rises when price closes higher and falls when price closes lower. This helps identify whether volume confirms the trend.
When price rises and OBV rises, the trend is supported. If price rises but OBV flattens or falls, momentum may be weakening. This divergence can warn of potential exhaustion.
OBV is most effective for trend confirmation, not precise timing. It works best when combined with structure and momentum indicators.
Support and Resistance Tools
Support and resistance tools help traders identify price areas where reactions are likely. These tools focus on structure rather than indicators derived from formulas. They are essential for context, timing, and risk placement.
Support and resistance levels work across all markets and timeframes. They improve trade location and help avoid entries in low probability zones. When combined with indicators, they add precision and clarity.
Pivot Points
Pivot points calculate key price levels based on previous session data. They are widely used in in day trading to identify potential support and resistance zones.
Price often reacts around pivot levels because many traders watch them. These levels are useful for planning entries, exits, and profit targets. Confluence with trend or momentum indicators increases reliability.
Pivot points work best in liquid markets. They provide structure during fast sessions and help reduce emotional decision making.
Fibonacci Retracements
Fibonacci retracements identify potential pullback zones within a trend. They are based on common retracement percentages observed in market behavior.
Traders use Fibonacci levels to anticipate where price may pause or reverse during corrections. The tool works best when aligned with clear trend direction and structure.
Fibonacci levels are not exact prices. They are zones. Confirmation from price action or indicators is required before execution.
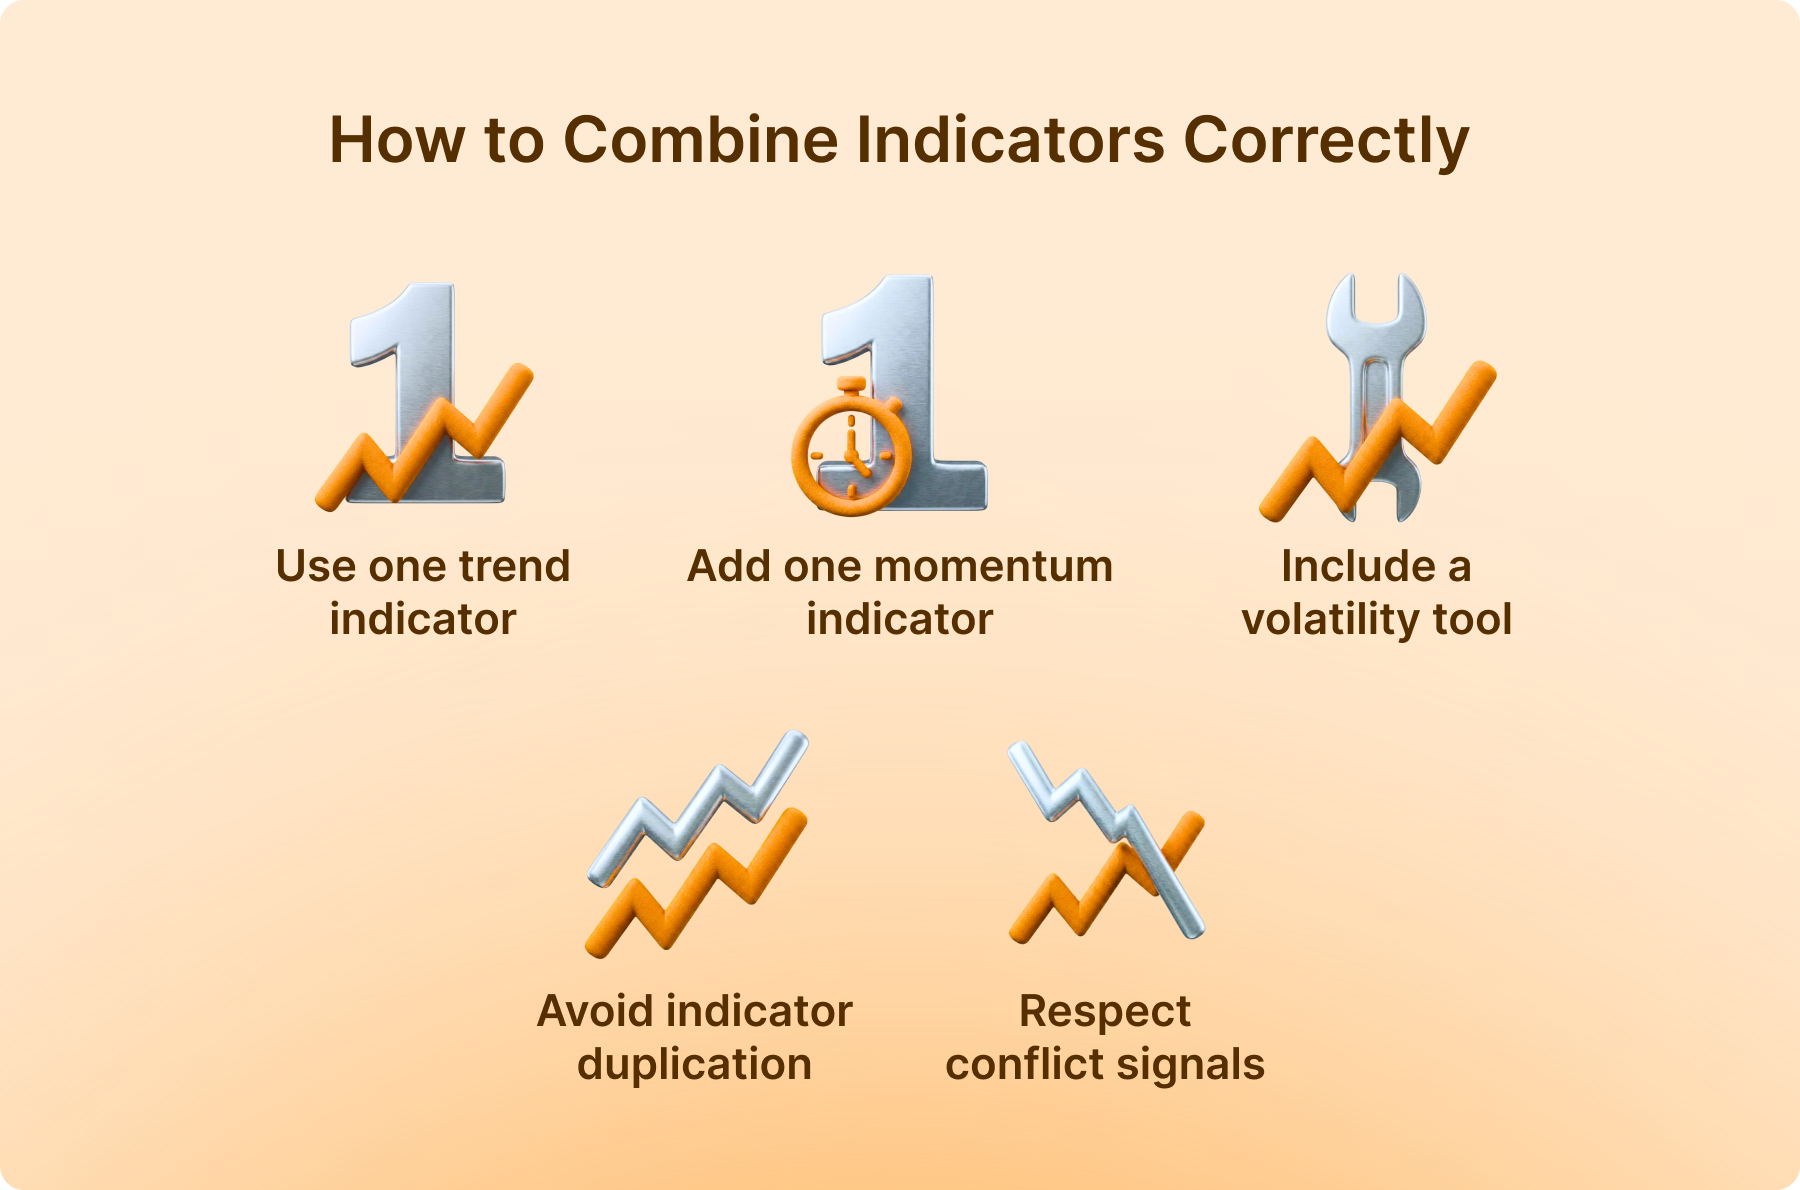
How to Combine Indicators Correctly
Indicators should work together, not compete with each other. Combining tools correctly improves clarity and reduces false signals. The goal is confirmation across different market dimensions.
- Use one trend indicator. Choose a single tool to define market direction, such as a moving average or ADX. This sets the directional bias and avoids mixed signals.
- Add one momentum indicator. Use RSI or Stochastic to confirm strength or weakness within the trend. Momentum should support the directional bias, not contradict it.
- Include a volatility tool. Indicators like ATR or Bollinger Bands help adjust stop loss placement and position size based on market activity.
- Avoid indicator duplication. Do not stack indicators that measure the same thing. Multiple momentum tools add noise without new information.
- Respect conflict signals. When indicators disagree, conditions are unclear. Standing aside protects capital and discipline.
Indicators for Different Trading Styles
Indicators should match trading style and timeframe. Using the same setup for all styles often leads to poor results. Each approach requires different information.
Day traders focus on short term momentum, volatility, and intraday structure. Swing traders rely more on trend direction and pullback confirmation. Position traders emphasize higher timeframe trends and long term momentum.
Adapting indicators to style improves relevance and reduces false signals. Fewer tools with clear purpose are more effective than complex indicator stacks.
How Many Indicators Should You Use
More indicators do not mean better analysis. They often do the opposite. Too many signals slow decisions and create doubt. Clarity disappears fast.
A practical rule is to limit indicators by function, not by number. Each tool must answer a different question about the market.
A clean indicator stack usually looks like this:
- One indicator to define trend direction
- One indicator to confirm momentum or timing
- One indicator to support volatility or risk decisions
If two indicators tell you the same thing, one is unnecessary. A good test is simple, remove one indicator and if your decision does not change, it was not needed. Strong traders do not win by seeing more, but by seeing clearly and acting consistently.
Example Indicator Setups
Indicator setups work best when they follow a clear logic. Each indicator should have a role and support a specific type of market behavior. Below are practical examples based on common trading conditions.
- Trend Following Setup. This setup focuses on trading in the direction of the dominant trend. A moving average defines bias. RSI confirms momentum. ATR helps place stops and size positions. Trades are taken only when price pulls back toward the moving average and momentum aligns with the trend. This approach reduces counter trend entries and improves consistency.
- Range Trading Setup. Range setups work in sideways markets. Bollinger Bands define upper and lower boundaries. Stochastic Oscillator helps time entries near extremes. Trades are taken near support or resistance inside the range. Profit targets are modest. Risk control is strict because ranges can break.
- Breakout Setup. Breakout setups target volatility expansion. Bollinger Band squeezes identify compression and volume confirms participation. Entries are taken after price breaks structure with rising volume. ATR is used to adjust stops for increased volatility. Confirmation is critical to avoid false breakouts.
Indicators vs Trading Strategy
Indicators are not trading systems. They do not replace planning, context, or risk management. A strategy defines when and why to trade. Indicators only support execution.
A strategy includes market selection, timeframes, setups, risk rules, and review process. Indicators fit inside that structure. Without rules, even the best indicator produces random results.
Successful traders build strategies first. Indicators are added only if they improve clarity or execution. Tools follow process, not the other way around.
Final Thoughts on Technical Indicators
Technical indicators are tools for clarity, not shortcuts to profit. Their value comes from understanding what they measure and when they work best. Used without context, they create noise rather than insight.
The most effective traders focus on simplicity and consistency. They use a small set of indicators with clear roles, combine them with price structure, and manage risk carefully. Mastery comes from practice, testing, and disciplined execution, not from adding more tools.