
In the wild world of binary options trading, the right indicators can make all the difference. Today, we’re diving into the best indicators for binary options — they all work great on the short timeframes, so choose your fighter!
1. Moving Averages
Moving averages are one of the easiest, most basic indicators for binary options. This tool is used to smooth out price data and help you spot the trend direction. Here are the main types of signals you may be looking for:
- If the price is above the MA, it’s a bullish trend.
- If it’s below, it’s bearish.
For binary options, traders often use short-term MAs with the periods of 5, 10, or 25. Instead of using just one Moving Average, you can combine two MAs in a strategy called the Golden Cross / Death Cross.
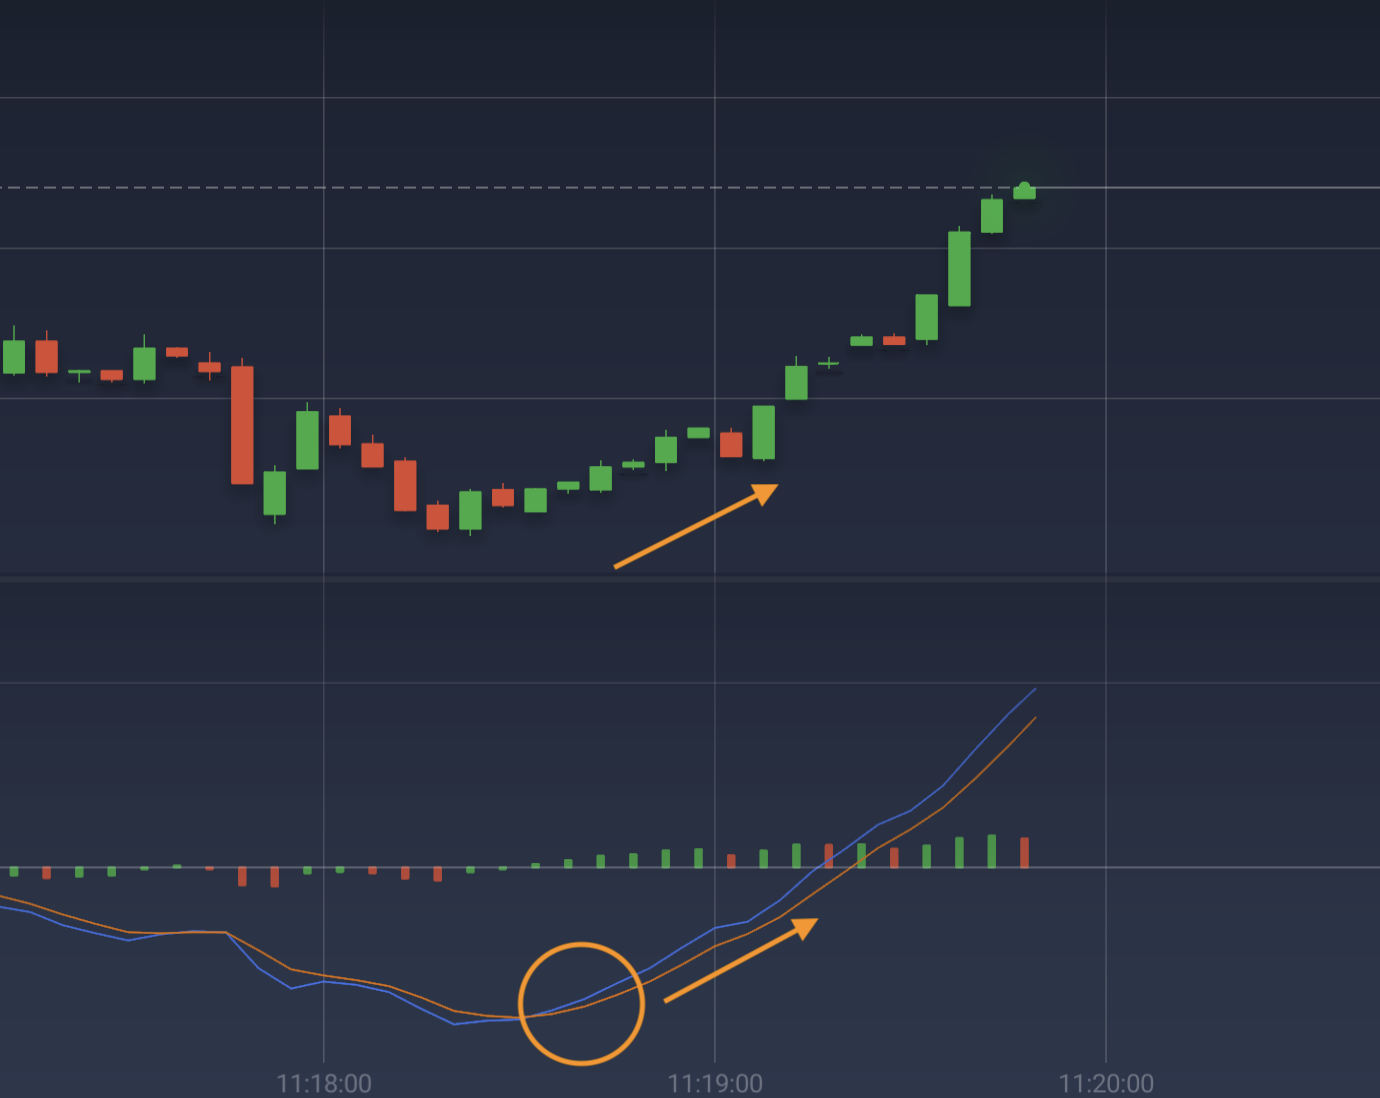
Golden Cross / Death Cross Strategy
Apply two SMAs with the periods of 5 and 15. Now, wait for them to cross. There are two possible signals you may see on the price chart.
Golden Cross
When a short-term MA (blue line) crosses above a long-term MA (red line), it’s a bullish signal. Consider opening a long trade (BUY).
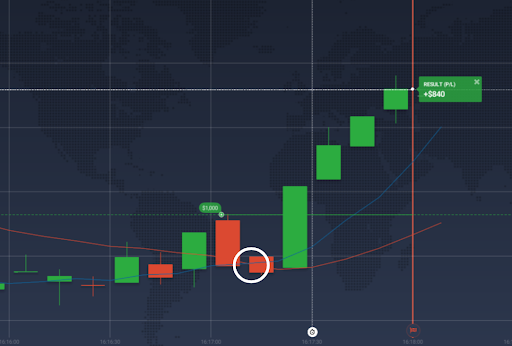
Here’s an example of a Golden Cross on a binary options price chart.
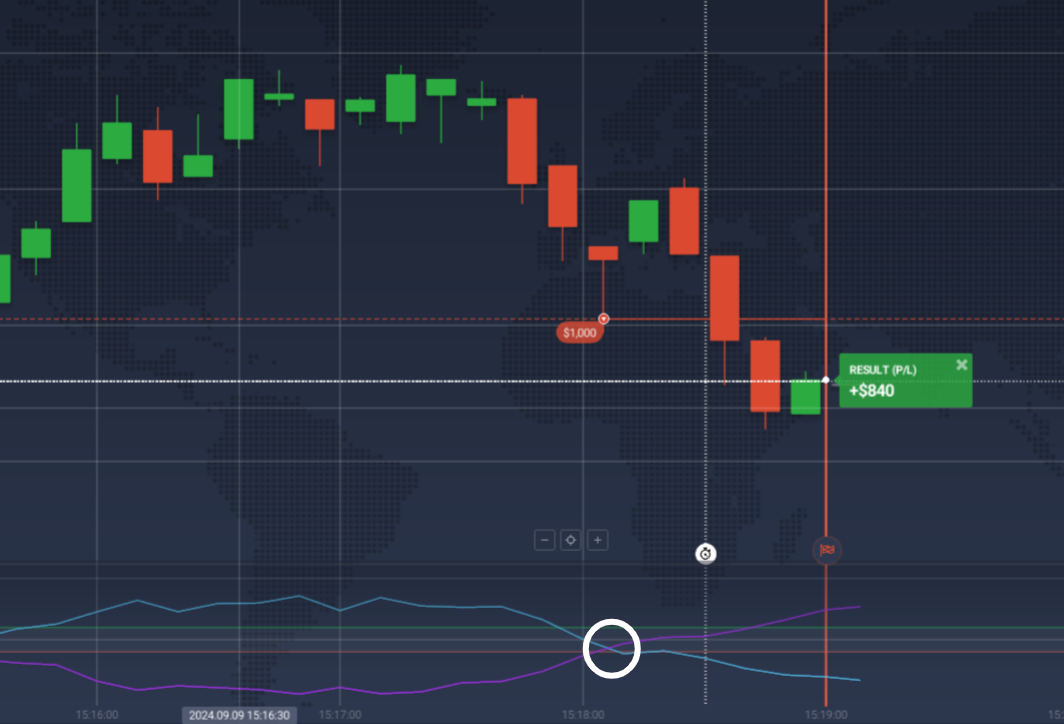
Death Cross
When a short-term MA (blue line) crosses below a long-term MA (red line), it’s a bearish signal. At this point, you might want to enter a short position (SELL).
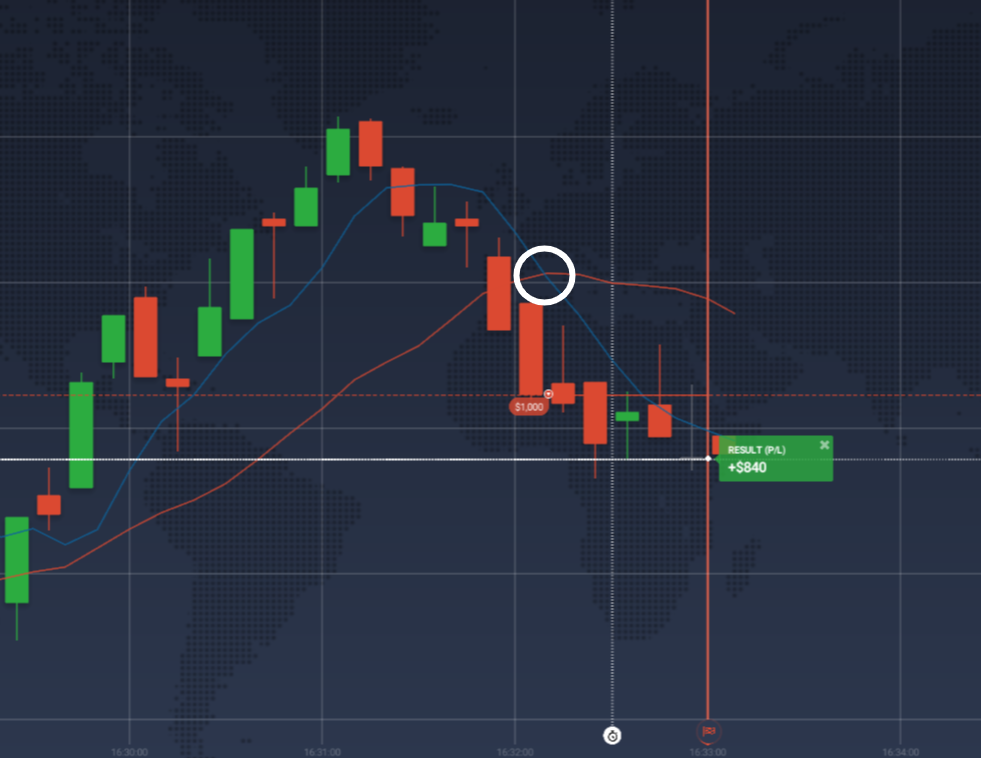
And this is a Deadly Cross, offering a bearish signal on a binary options price chart.
2. MACD
MACD, or Moving Average Convergence Divergence, is like the Swiss Army knife of trading indicators. It helps you gauge trends, momentum, and even divergence. Here are some binary options technical analysis tips for MACD.
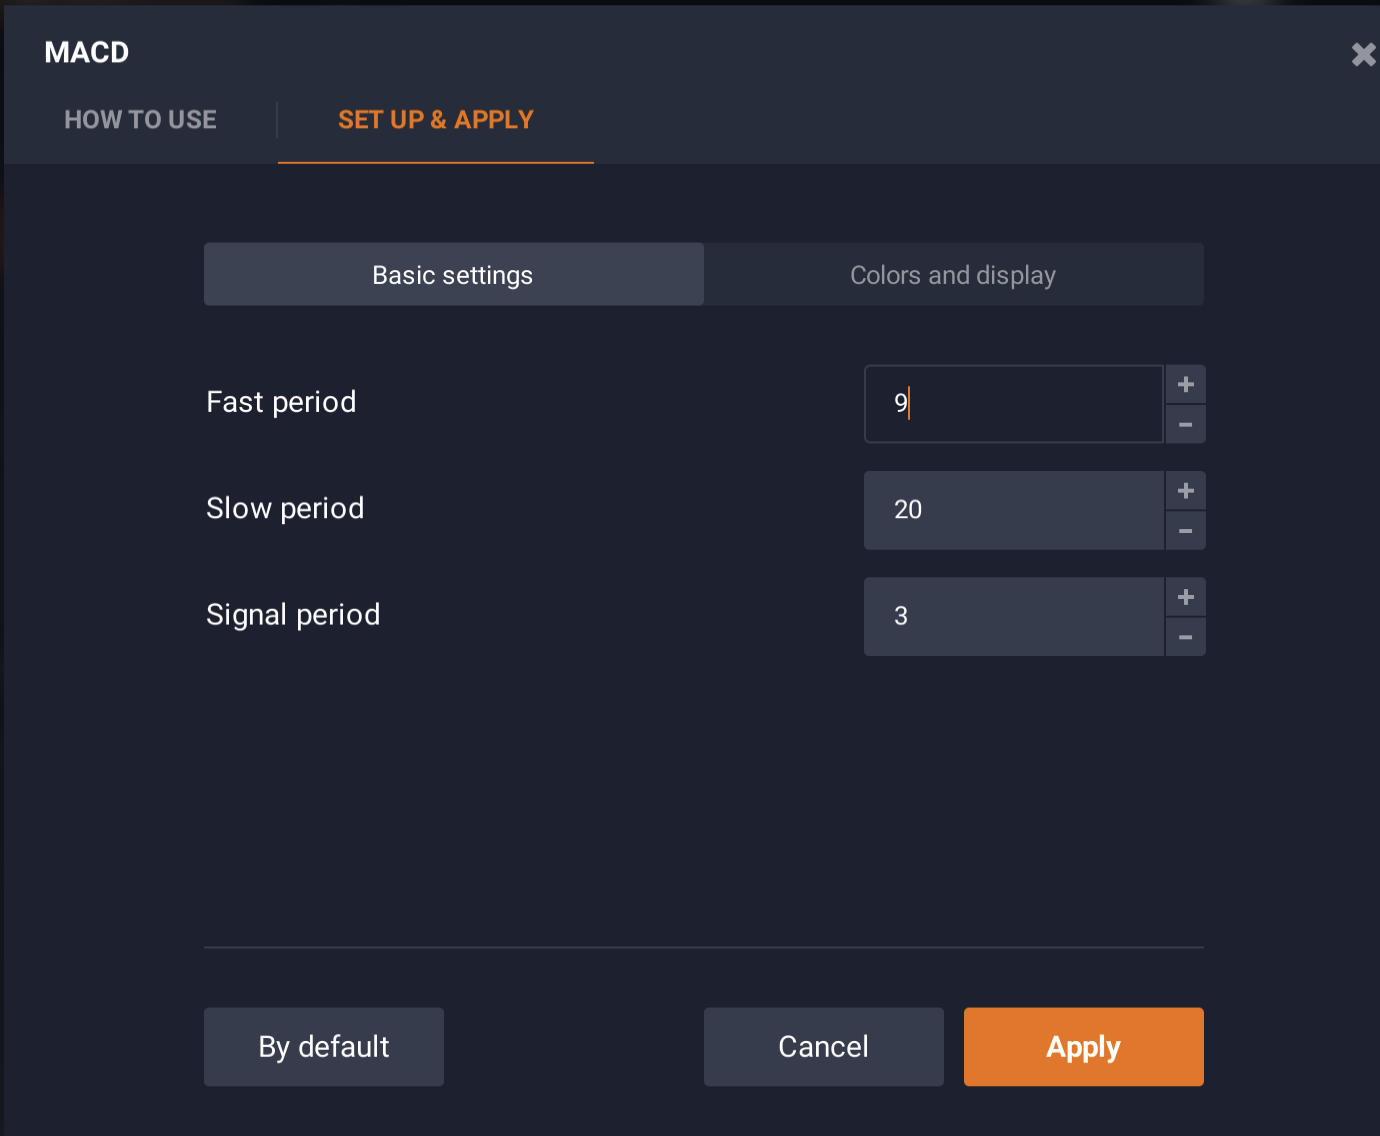
1. Tweak the settings: Set the short-term MA to 9, the long-term MA to 20, and the signal line to the value of 3.
2. Read the signals: Decide if the signal is bullish or bearish to make the right move.
- Bullish sentiment: The MACD line (blue) crosses above the signal line (orange). Look for a candlestick above the crossover in the direction of the MACD line.
- Bearish sentiment: The MACD line crosses below the signal line. Again, look for a candlestick above the crossover.
Here’s an example of a bullish Binary Options signal from the MACD indicator.
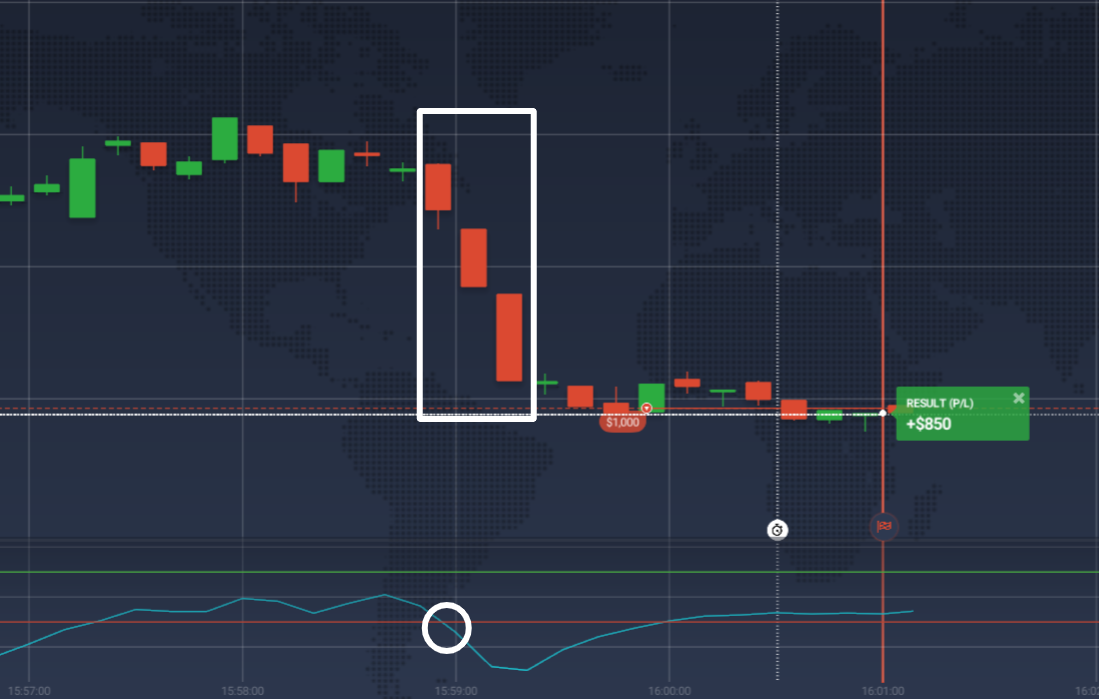
3. Vortex Indicator
The Vortex Indicator is probably the most accurate indicator for binary options. It’s all about the crossing lines – blue and red – that signal when to go higher or lower.
How to use it:
- Apply the Vortex indicator with default settings.
- When the blue line crosses above the red line, it’s time to press Higher.
- When the blue line crosses below the red line, press Lower.
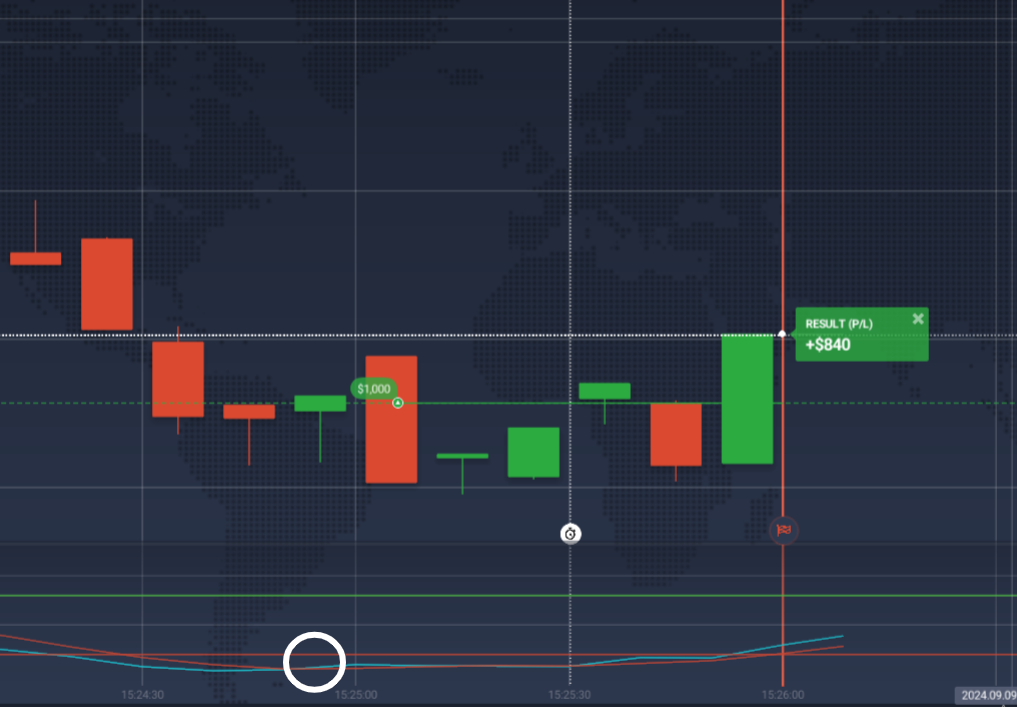
4. Stochastic Oscillator
The Stochastic oscillator measures momentum and is basically a radar to see if the market’s getting too hot or too cold. Here, two lines (%K and %D) move between 0 and 100. Readings above 80 indicate ‘overbought’ while those below 20 imply ‘oversold.’ The Stochastic is listed among the best indicators for binary options trading.
Here is how it works:
- Buy signal: When the %K (blue) line crosses above the %D (red) line below the 20 level.
- Sell signal: When the %K line crosses below the %D line above the 80 level.
5. The Commodity Channel Index (CCI)
The Commodity Channel Index helps you understand the strength and direction of the trend by comparing the current price to historical averages. It’s also known as one of the most efficient technical indicators for binary options.
Here’s how it works:
- Bullish trend: If the CCI line moves from 0 closer to 100, it’s an uptrend.
- Bearish trend: If the CCI line drops from 0 closer to -100, it’s a downtrend.
Action: Wait for 3-4 candles in the trend direction after a breakout to confirm the trend before trading.
Conclusion
If you’re aiming to improve the accuracy of your short-term trades, consider using these five best indicators for binary options: Moving Averages to identify trends, MACD for versatile trend insights, Vortex for clear entry points, Stochastic Oscillator to measure momentum, and CCI to assess trend strength.
Mastering these tools will help you make more informed decisions and increase your chances of trading success.