Ichi Moku Kinko Hiyo (from Japanese “one glance equilibrium chart”) is arguably the most daunting technical analysis tool ever created. It was developed by a Japanese journalist in the 1930’s to track financial markets in a manner that could be properly displayed in the news. The Ichimoku is based on the use of several moving averages. This indicator is supposed to provide an indication of equilibrium (or the lack thereof) on the market.

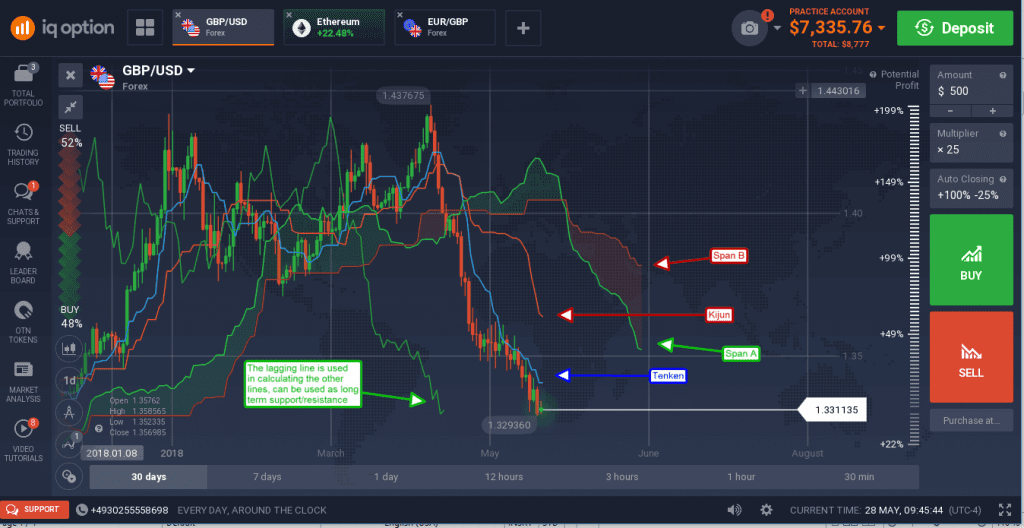
Ichimoku Cloud on the price chart
There are five major readings on the Ichimoku chart. They are as following: the Tenken line (blue on the IQ Option chart below), the Kijun line (red), cloud span A (green), cloud span B (red) and cloud areas which are shaded in. The cloud span A and B are lines based on the moving average used to create the Kijun line. The Kijun line is a moving average based on a 26-period calculation that is used as a baseline for direction.

The Tenken line is a shorter moving average based on a 9-period calculation. It is used to deliver directional indications along with the Kijun line. When the Kijun line goes up, the market is also moving higher — and the bullish crossover made by the Tenken line points at a possible entry point. The cloud spans form a dynamic support and resistance used as targets for long term entry and exit signals as well as possible reversal points in the market.
The two cloud spans act like nested moving averages which means that one by itself is a target for support or resistance but the two together are much stronger. In most cases what happens is that the lines will form crossovers like moving averages. When the leading cloud span A is below cloud span B it forms a bearish resistance target because prices are below the cloud, the reverse is true for the opposite. If prices are above the cloud it forms support.
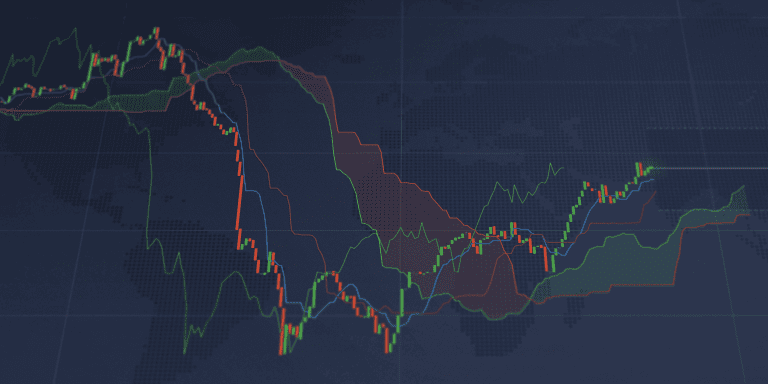
There are three basic ways to trade with this tool. The first is the bullish trend following. If the price action is above the cloud the trend is up. In this case trend following signals are the only to be taken into account. Signals can be based on crossovers of the Tenken and Kijun lines, prices bounce or crossovers of each of those lines, crossovers of the cloud span lines or other commonly accepted bullish indications.
The second method is for the range bound market. When price action is within the cloud the market is ranging and neutral strategies should be employed. This means watching support and resistance targets for reversals and being wary of false signals and whipsaws. This is also the time when the market is said to be in equilibrium, at least according to this indicator.
The final method is for bearish markets. When prices are below the cloud the trend is down and only bearish positions should be taken. This means following bearish crossovers and price bounces from the cloud, the tenken or kijun lines for bearish candle formations.

