If you are only using one or two indicators to plot your trades its why most of them fail. I’m not saying that your indicators are bad or that your analysis is wrong. What I’m saying is that by using only one or two indicators you aren’t weeding out enough of the false technical entry points. Yes, crossovers and bounces and breakouts are all great signals but if you only trade one type of indicator you’re catching the average, day to day, market noise and not the big movements we all like to see.
Think about it like this. There are a handful of commonly used indicators that we can safely assume are used by all market participants. All market participants won’t use all the indicators, but these indicators are used by 100% of the market. This means that if you use only one or two indicators the entry points you see only represent a small portion of the total market.
Hypothetically speaking, if there are only 10 indicators in use and those indicators are each used by 25% of the market a signal produced by any one of them will only have a 25% chance of success. If, however, you were to use two or three indicators in unison the signals would represent a far larger share of the market and therefore be more reliable.

The caveat of course is using too many indicators, especially when you are first starting out. Too many indicators can be confusing and clutter the chart. It’s best to start with trend, follow the trend and then add indicators as you learn to use them. The more of the market you can represent on your charts the better. When your indicators come into alignment you will have what I call a “strong entry signal”. The hardest part is having the patience to wait for the market to line up with your trade.
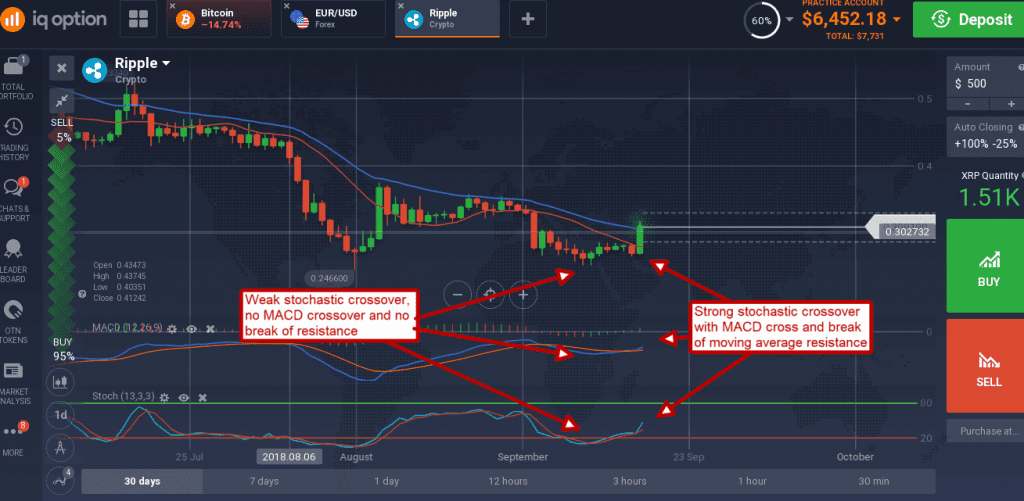
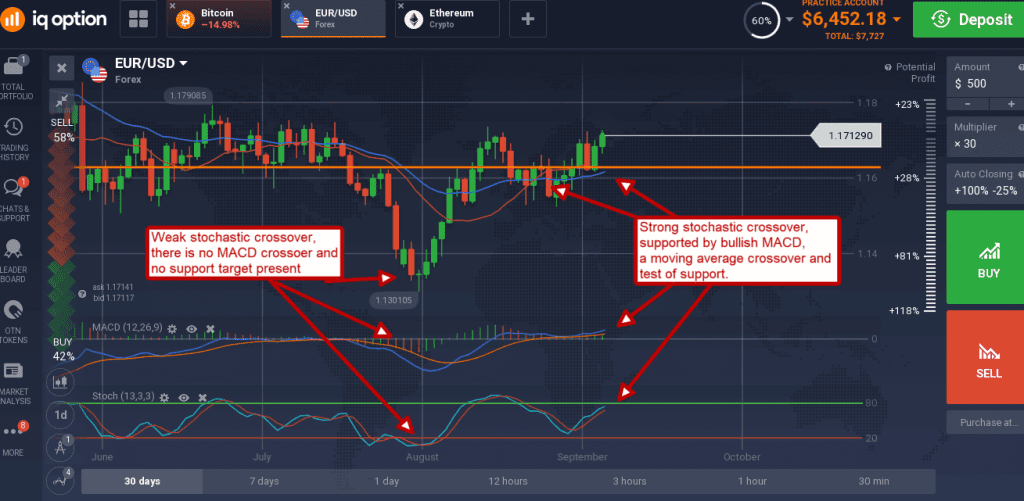
For myself, trades often start with support or resistance. Support and resistance are prices levels on the chart where I can expect to see a signal occur because they are levels where signals have occurred in the past. When price moves up or down to one of my lines it can often produce a bounce but that doesn’t mean it’s going to be a strong bounce. In this case I would call it a weak signal, it may be one I trade for short-term gains, but I won’t expect it to move far or for the price movement to last long.

If prices were to move back and retest support (could be a trend line, moving average or static price level) and produce another bounce I would call that another weak signal. If the second bounce was accompanied by a bullish crossover in the stochastic or MACD I would call it a moderate signal, one that may last longer than the first or perhaps move higher. If there were crossovers in both the MACD and stochastic I would call that a strong signal and trade it appropriately. Weaker signals use smaller trade amounts to control the risk while stronger signals use larger trade amounts to take advantage of the high-probability opportunity.

