Strong GDP figures point to solid growth acceleration within the US economy and yet the dollar weakened on the news, find out why in this article.
It’s All About The Price Increases
The US second quarter GDP estimate came in at 4.1% and as expected. The gains point to a robust expansion of the US economy and are expected to continue into the end of the year, at least. The strength was centered in a broad array of economic segments including Personal Consumption, Exports, Real Estate Investment and Government Spending. The news is a plus for markets focused on possible impacts from trade disputes and would normally lend strength to the dollar.
The difference is that price increases moderated from the first to the second quarter, indicative the FOMC’s current rate-hiking trajectory is adequate to control inflation during these expansionary times. The GDP PCE Price Index came in at 2.2%, a hair above the FOMCs 2% target, and down -0.2% from the previous quarter. On an ex-food+energy basis core price increases were a more tepid 2.0%, also down -0.2% from the previous read. The takeaway is that price acceleration has slowed, and slowed to a point at which the FOMC may choose to hold off on future hikes, at least for a while.

The FOMC maintains a 2% target, a target favored by economists because it balances growth with stability, and has said that they would like to see inflation top their target for a short while before clamping down hard on economic growth. The market reacted by downgrading expectation for rate hikes at the next three FOMC meetings although outlook for a 4th hike in 2018 are still running above 65%.
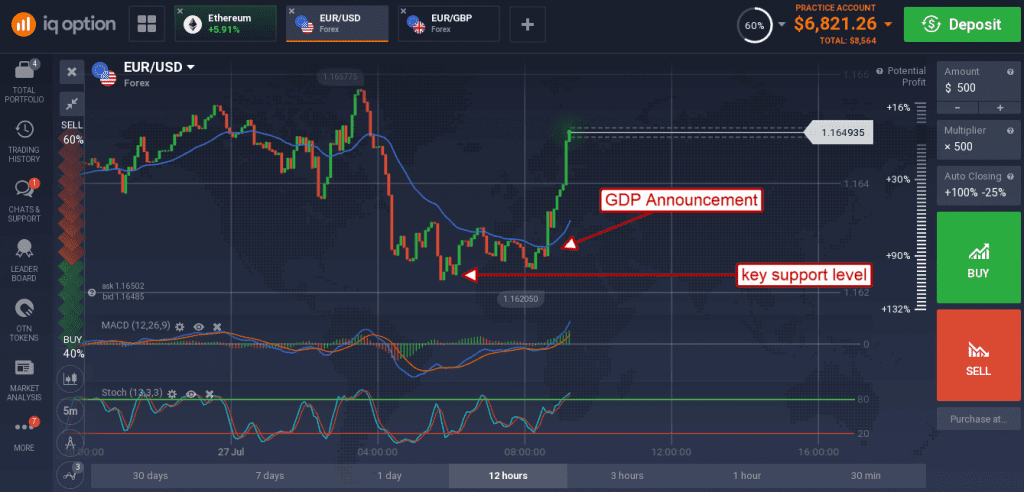
The EUR/USD saw a little volatility on the news, first moving lower only to find support. Within minutes the pair was firming, moving higher and confirming support at the key 1.6250 level. This level is consistent with a +1 year low and has played a major role in price action over the past two months.

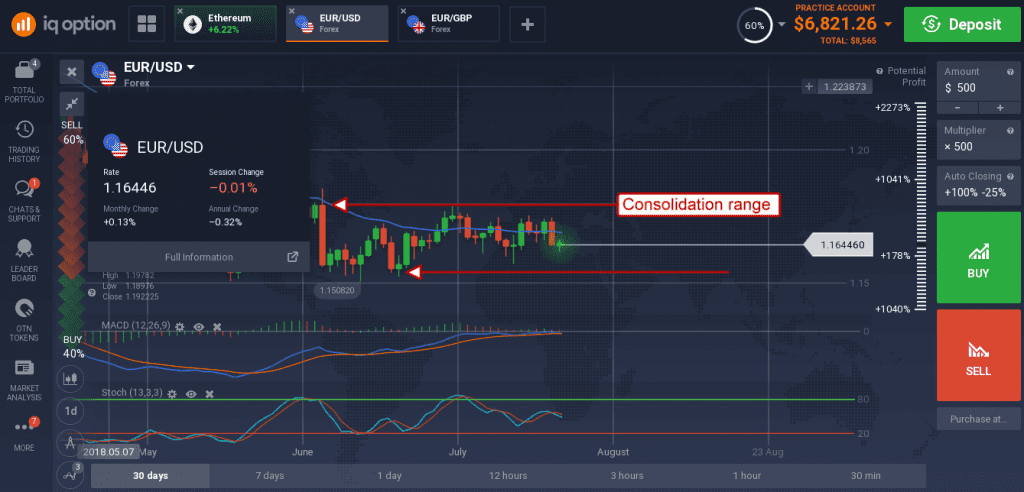
The daily charts remain neutral, the pair is moving sideways within a major consolidation band and looks like it will remain within that range for the near term. The indicators are pointing lower in the near term, indicative of Friday’s test of support, but are consistent with range bound trading so a break of the range is not expected at this time. Support is 1.6250, resistance is 1.7555. Looking forward, next week could bring additional volatility to the pair and a chance of a directional move in prices. Not only is there key inflation data (more current than Friday’s GDP release) from the US and EU that will have an impact on outlook for both the ECB and FOMC.

