If there is one thing you can do to hamper your trading it is to over-complicate your analyses. Nowhere is this more evident than with Bollinger Bands ™, one of the markets most versatile indicators in technical analysis. Not only does it give an indication of volatility and direction, it provides dynamic support and resistance targets that often result in sharp reversals. While you can try to trade the myriad nuances of the indicator, the far better strategy is keeping things simple and trading the convergence and divergence of the bands.
I used the terms convergence and divergence purposefully. I wanted to make you think about MACD, the Moving Average Convergence Divergence tool, another tool that works in a fashion akin to Bollinger Bands. Where in MACD the convergence/divergence is between the movement of two moving averages, with Bollinger Bands it is the movement of the upper and lower band.
To quickly recap, Bollinger Bands are a tool that uses a center line (a moving average) to create a price envelop based on standard deviation. The tool assumes that most market participants are represented by price action within 2 standard deviations of the center line. This means that under normal conditions (the market is not trending) the envelop will provide support/resistance and under extraordinary conditions (the market is trending) a break of the bands indicates direction of market movement.
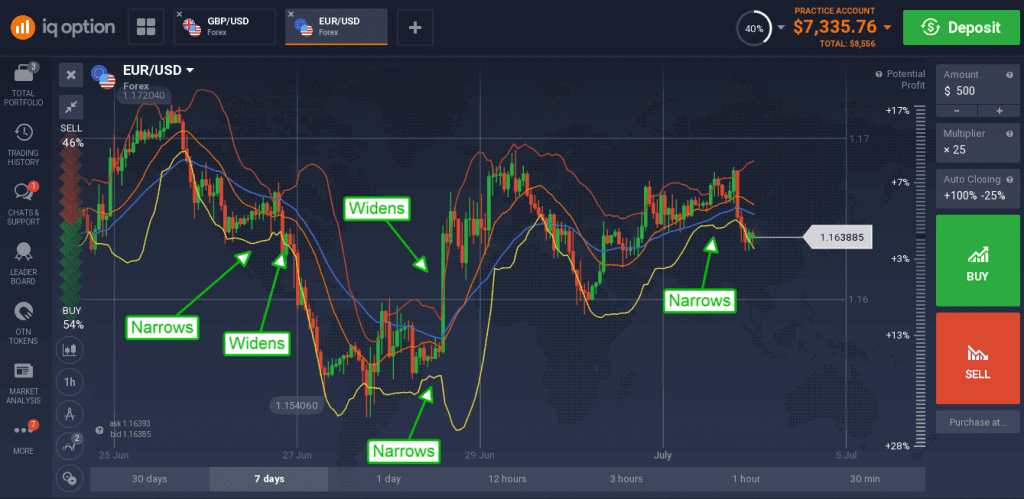
Now, how does this relate to convergence/divergence and the best tactic for Bollinger Bands? Simple, when conditions are extraordinary (the market is trending) or about to become that way, the bands will diverge and when conditions are ordinary or normalizing to ordinary the bands will converge. Look at the chart below. It is the EUR/USD hourly chart with an overlay of Bollinger Bands clearly showing a series of convergence and divergence. (PS, you can use any time frame you like).

The tactic for day traders is to use that convergence/divergence to your advantage. The trick is patience. You want to wait for the bands to narrow down as skinny as possible and then wait for them to widen. The narrowing of the bands shows the market is calming, or nearing a point of equilibrium, ahead of an expected (or not expected) catalyst. When the catalyst, a news story or economic event, happens the market will react. If the reaction is strong enough, the event good enough, the market will begin to move and when it does the bands will widen. The widening of the bands is the first, but not always the best, signal for entry.

The best signal for entry is when the bands are broken, and prices close above or outside the bands, a sign of truly strong market movement. You won’t know the movement is strong enough to trade until that happens, when it does trade in the direction of the break using any weakness (in a rally) or strength (in a selloff) as your point of entry.

