
The Heikin Ashi charts are a great tool I’ve recently discovered on the IQ Option platform and its one I like. What I will say about it first is that it’s not as simple as following the candles. You can’t just enter a trade on the close or open a Heikin Ashi candlestick because those aren’t “real” prices, they are average prices based on the movement of the price of the asset.
If you see a long red candle you can’t enter a trade at the open of the next candle the way you do with traditional candlesticks because the open is based on the midpoint of the previous candle, it’s a mathematical computation and may never be reached once set. What you can do is use the opening price as a target for entry, if the assets price moves up to touch this level expect it to produce resistance. Otherwise you will need to use some other target for entry which may include a support/resistance level carried over from a regular candle chart, a moving average crossovers or bounces, or technical indicators.
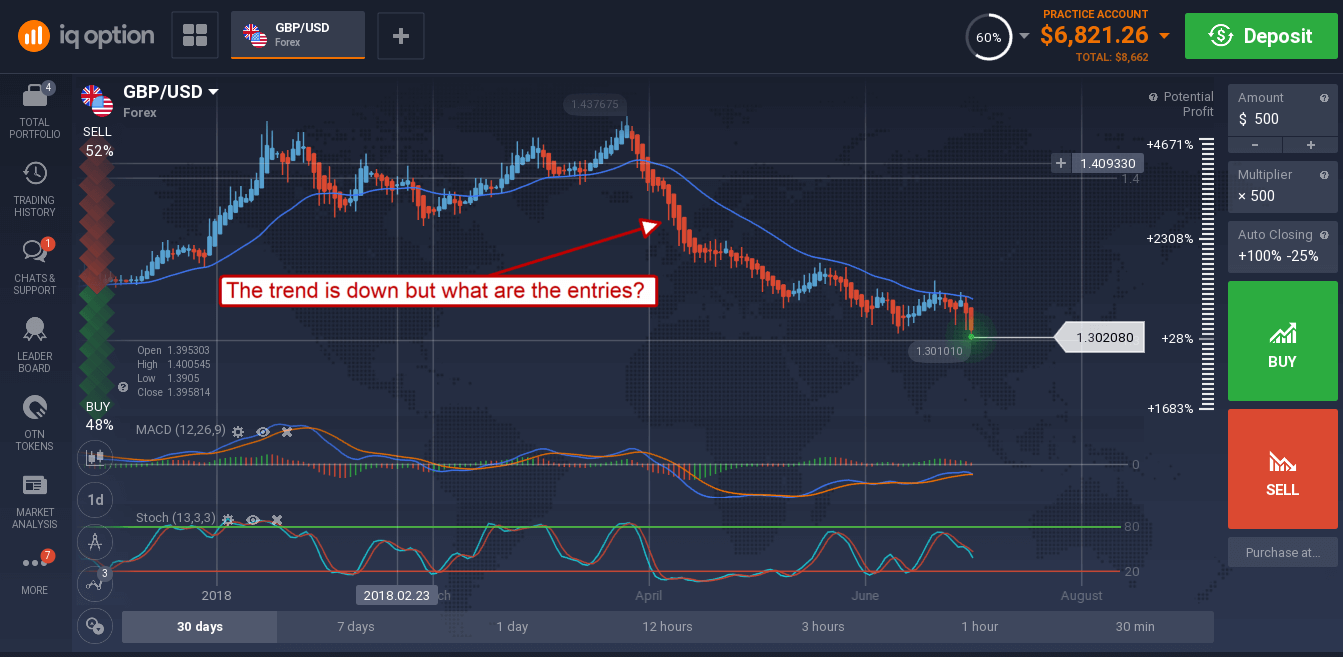
Heikin Ashi is easy to follow when an assets price is trending strongly, the long candles make it clear a big move is underway. The question is when to enter the trades, what is the indication for entry points? Look at the chart below, it shows a strong downtrend in the GBP/USD marked by a long series of red candles. Although the candles are long and show a strong trend, many are right next to each other which means it would be easy to go short at the wrong price and wind up with a losing trade.
Changing time frame could be a help, what I’ve found is that the chart is more suited for longer term trend-following trades, so I use the daily charts. The shorter-term charts are often too volatile to produce a clear candle signal. These techniques work best with Heikin Ashi because trends are clear, and the reversals/consolidations are easy to spot. These points can be used as entry and exit points and can result in large movements in the underlying asset if you have the patience to wait for them.
Let’s look again at the GBP/USD and I’ll show you what I mean. There is a clear downtrend beginning in early April when the moving average is broken. From that point on the long red candles are just continuation signals that last until mid-month. At that time the candles get smaller, a blue candle appears and a possible change in trend is occurring. This is the signal to close the first trade and be ready for the next trade. The blue candle suggests a bullish trade may be coming, but it is not confirmed, and the downtrend continued.
