Binary option traders take heed, an important indicator is hitting new lows signaling bull market conditions and rally ahead.
The Fear Index Hits Long Term Lows
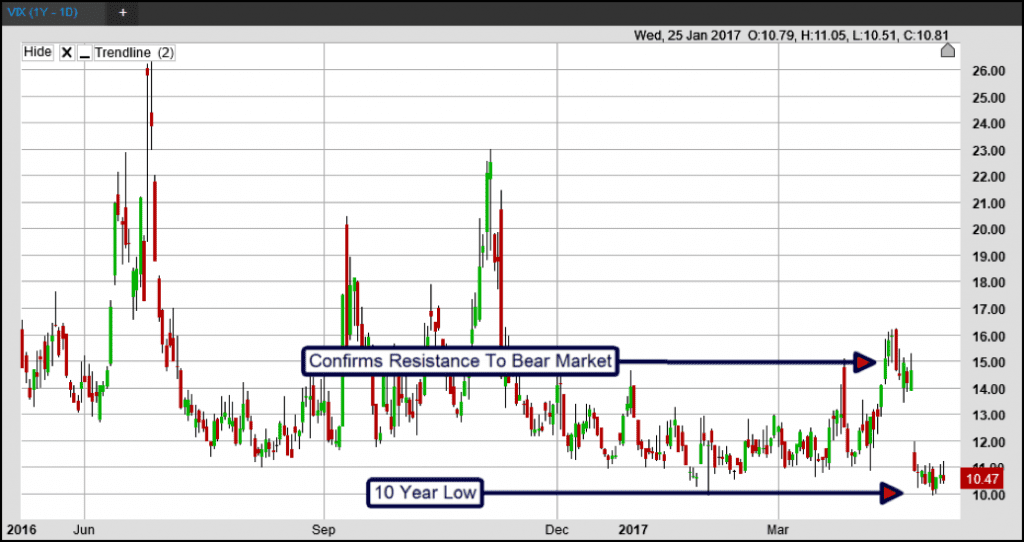
The VIX index hit a new 10 year low and is now trading at levels not seen since before the Housing Bust, the Global Financial Crisis and Great Recession. The index, also called the Fear Index, is a gauge of equity options prices relative to the S&P 500 and used as indication of market emotion or calm. A high reading suggests fear and reversal while a low reading suggests market calm and bull market conditions. The index has been trending lower in tandem with the slowly rising US market, the latest development an indication that not only will the bull market continue, it may begin to accelerate as the major indices break out to new all-time highs.
- The VIX tends to move counter to the underlying index. When the S&P 500 trends higher the VIX trends lower, when the S&P 500 trends lower the VIX trends higher.
The index tends to trade within long and near-term ranges as market conditions change. The assumption is simple. In a falling market, as traders fear rises and the cost of “protective options positions” increases so to will the value of the VIX. A VIX that trends higher is a sign of mounting fear while one that trends lower a sign of declining fear. Historically, a reading above 20 is a sign of bear market conditions and a reading below 15 a sign of bull market conditions. The index is now trading near the 10 level and indication of long term, secular, bull market conditions.
The caveat for traders is that the low VIX reading may indicate a market that is too complacent. There are a number of issues hanging over the market including geopolitical uncertainty and sluggish global GDP growth that could derail the bull market. Some traders fear the lack of fear is leaving the market open for a major correction that could take the S&P 500 down by -10% or more.

Regardless, unless the index moves above 15 and stays there it is likely the long-term secular bull market will remain intact unless and until forward earnings growth outlook turns negative. At this time the broad market is expected to experience double digit YOY earnings growth at least until the end of 2018, if not beyond. Any spikes in the VIX and subsequent downturns in the S&P 500 will likely be starting points for near and short-term rallies.
While it likely a binary options trader will never trade the VIX it is still an important tool in the traders arsenal. It measures implied volatility in the underlying market, the S&P 500 broad market index, and as such is an indication of expected movement. Traders can use the index to gain deep insight into the broad market as well as specific trading signals for the S&P 500 including entries for bullish and bearish positions and confirmations of support and resistance.
* Past performance is not a reliable indicator of future performance.
** Forecasts are not reliable indicator of future performance.

