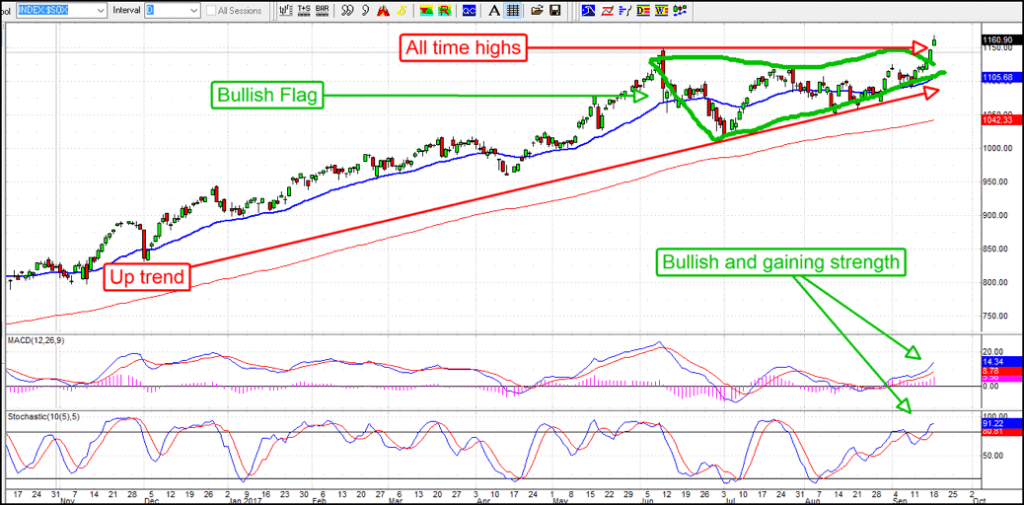
When it comes to technology it’s all run by microchips and semiconductors which makes that segment of utmost importance. In terms of the market and we as traders the semiconductors are a leading indicator; when they does well techs do well, when they do poorly tech does poorly. With this in mind a look at the chart of the Philadelphia Exchange’s Semiconductor Index helps put this into perspective. The index broke to a new all time high this week, supported by the indicators and set to move higher.
Recent news from the sector is quite promising. Aside from strength in consumer electronics there are at least 3 points of focus driving gains. The first is cryptocurrency. The explosion in cryptocurrency, and in particular cryptocurrency mining, are driving sales of high performance graphics chips used to power mining rigs. The second is self driving cars. Self driving cars seemed like a dream only a few years ago but is now being worked on by virtually every automaker and most chipmakers. The third is AI, artificial intelligence. AI is the next wave of computer innovation and expected to power much of our future technology.
Semiconductor revenue totaled more than $101 billion in the 2nd quarter alone. This is up more than 6% over the previous year and not expected to slow any time soon. On an annualized basis earnings growth in the Infortech sector is expected to top 10% in 2017 and grow to over 12% in 2018.
AMD is a leader in the crypto-mining segment as well all other uses of high power graphics chips, posting industry leading revenue and earnings growth in the 2nd quarter. Intel has announced the investment of $1 billion into AI technology and the use of its chips in over 3 million miles of real world driving. NVDIA posting the industries second largest YOY revenue growth in the 2nd quarter led by sales of crytpo mining chips and AI chips for self driving cars; the company has also received two major upgrades in the last week.
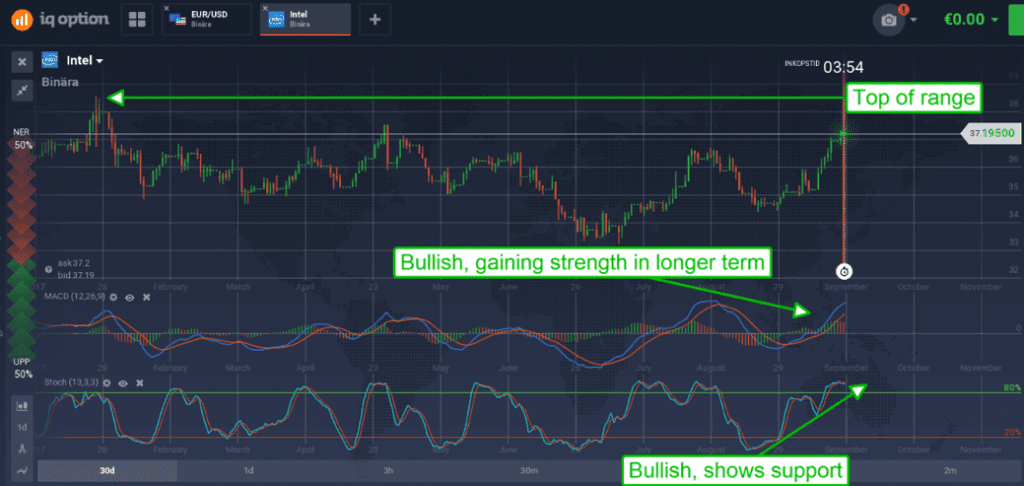
The AMD chart does look as bullish as the sectorand the outlook. This stock is languishing at a support level and sideways for the year with the caveat that support is the long term moving average, price action is confirming support, the long term trend is up and the indicators are firing a bullish entry signal. A move up from this level would confirm the signals with upper targets near $14.50. The Intel chart is equally non-impressive with the caveat it is indicated higher within its long term trading range. The stock has recently crossed above one potentially major line of resistance and is heading up to test resistance at 5 and possibly 8 month highs.
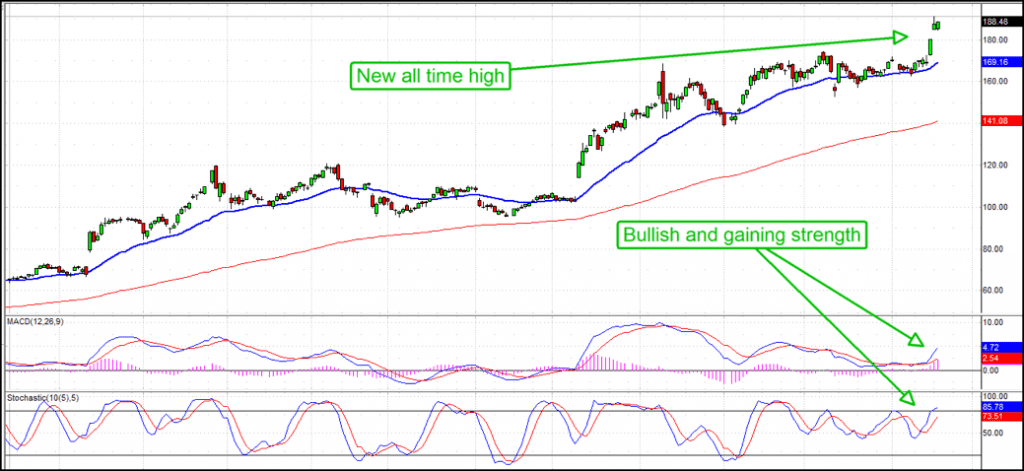
The NVIDIA chart is more in line with the sector outlook. This stock has bounced strongly from its short term moving average, it has broken to a new all time high, it is consolidating at those highs and supported by bullish indicators. This stock is on the move and heading higher with targets near $210 and $230 in the near to short terms.
The NASDAQ Composite is a step behind, lagging the Semi’s by a small margin. The index is however forming the same bullish triangle pattern and supported by strong indications. The only thing holding this chart back is an actual break to new highs to confirm the move. Such a break would be bullish and trend following with near and long term targets in new all time high territory.

