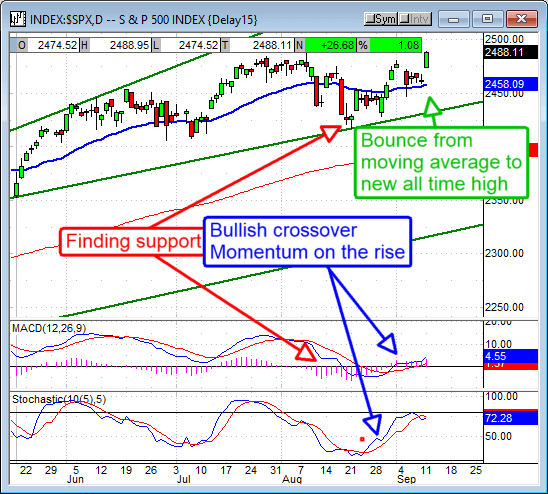
The broad US stock market index S&P 500 set a new all time closing high Monday afternoon even as Hurricane Irma wreaked havoc on parts of the southeast. While surprising to some, the reason is simple; underlying fundamental conditions remain intact and the clean-up will generate billions in economic stimulus. Add to that relief over the actual damage done and the spark was lit, the rally was on.
Initial estimates for Irma’s damage was in the hundreds of billions. JP Morgan said in a statement that it would be a top 5 damaging storm, this was backed up by Moody’s analysts estimating costs at over $200 billion. Now the storm is past it is clear that damage is severe and widespread, and far less than feared. A well regarded damage estimating firm puts the numbers at about $50 billion and “likely far less”.
Futures trading Monday morning indicated a broad but light rally, advancers led decliners more than 4 to 1 on below average volume. The indices opened trading with gains in the range of 0.5% and extended that throughout the day as it became more and more evident that the worst the storm could offer was not to come. The S&P 500 closed the day with a gain slightly greater than 1.05%, and at a new all time closing high.
The days resistance was the current all time intraday but this level looks easily broken. Trading early Tuesday had already surpassed the all time high in the futures market and this move is supported by the technical read out. The index has been in a prolonged and protracted bull market up trend and is now indicating a strong buy.
Over the past few weeks the index has confirmed support along a long term up trend line, the long term 150 day moving average and the short term 30 day moving average. The index is now bouncing higher from that support bundle and indicated to have some strength. The MACD momentum is bullish and building following a trend following bullish crossover. The stochastic confirms support, has fired not one but two strong trend following signals and is now set up for a third. An actual break to new all time highs would be bullish and confirm these signals. Upside targets are 2,560 in the near term and 2,660 in the short to long.
Forward outlook does support market rally. Economic trends suggest steady GDP growth in the range of 2% at the low end and upwards of 3% at the high. In the near term there will be anomalous economic readings due to storm impact but any market weakness caused by such news are likely to be entry points for bullish positions and not signs of reversal. In terms of earnings outlook is also supportive of rally. We’ve just come off a quarter of double digit earnings growth and looking ahead to at minimum 5 more of the same.
Storm outlook. Hurricane Jose is still churning out there in the Atlantic and has the US in its eyesights. This storm was expected to turn northward and peter out into the Atlantic but has stymied weather modelers, it is now expected to complete a full 360º turn and refocus on landfall. The storm is a small category 1 at this time but would add to damages already done nonetheless.


