
Bitcoin is cherished by technical analysis specialists, and for a good reason. The world’s largest cryptocurrency usually demonstrates clear and easy-to-follow trends, while also having distinct support and resistance levels. Situated at around $3,000, $4,000 and $5,000, they provide an insight into basic market psychology. Unable to align their decisions with fundamental factors (which are scarce), traders turn to technical analysis.
Now it looks like the moment of truth for Bitcoin and the cryptocurrency market in general. The most recent plunge, initiated on September 2nd, is far from over. Yet BTC has a chance to reverse the negative trend and reaffirm its growth. Bitcoin is demonstrating remarkably curios behavior since the last downfall of the cryptocurrency market. BTC has been growing exponentially since late April 2017. By September 2017 it was traded at around $5,000. The coin then depreciated, certainly moved by the massive selloff. The majority of traders (or at least the most influential minority) have decided that $5,000 was too much for a single Bitcoin and market confidence in the future growth faded. The price action then retracted to $3,000, smoothly cutting through the $4,000 level. When the price hit $3,000, however, the trend reversed once again. This time the market decided that $3,000 per Bitcoin is a good purchase opportunity, creating a buying pressure and driving the BTC price back up.
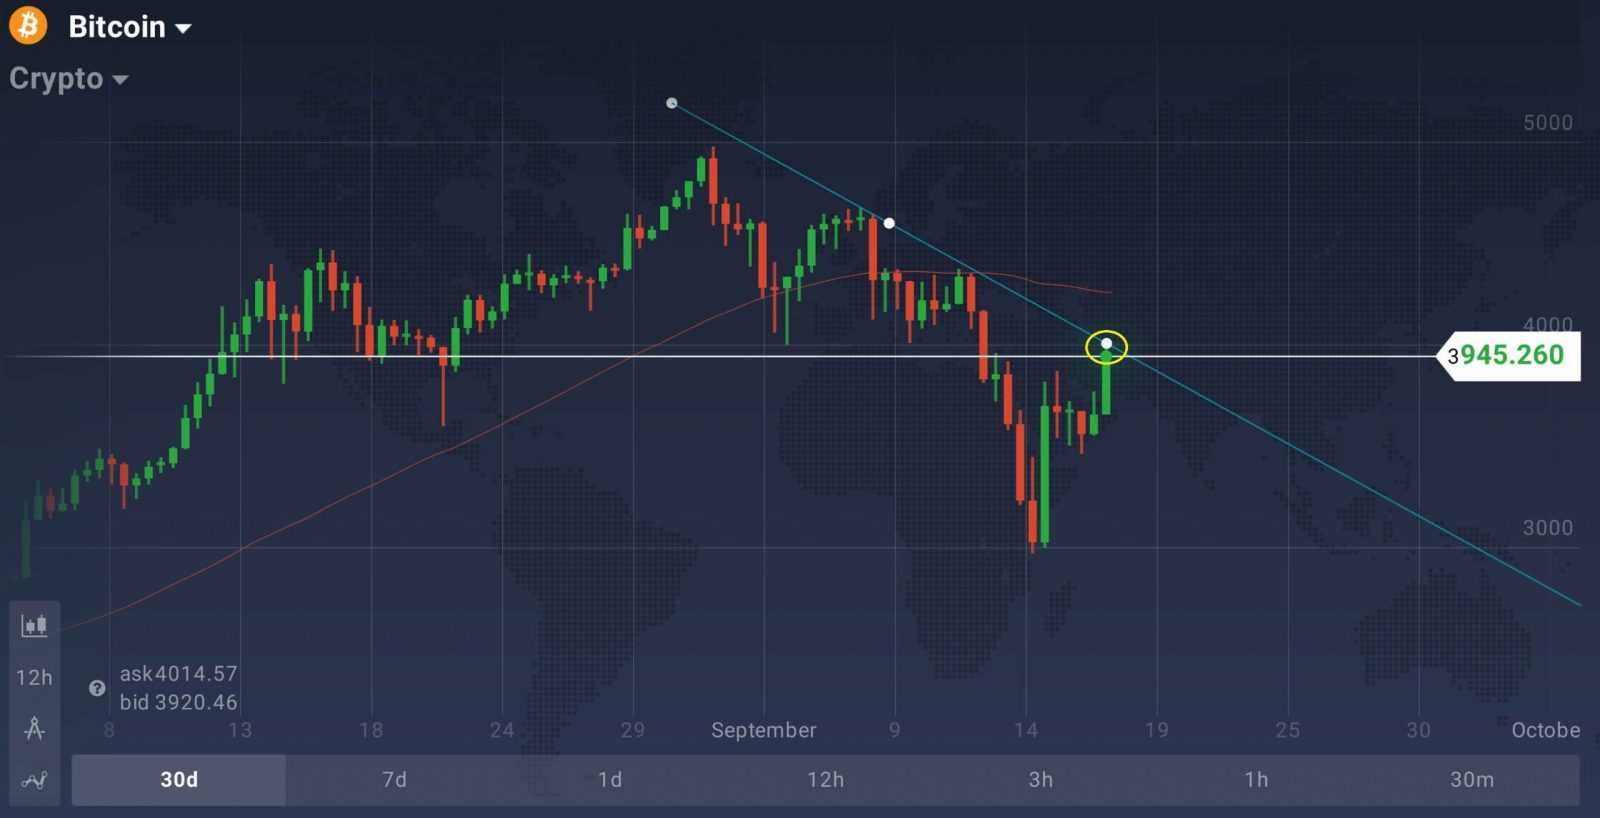
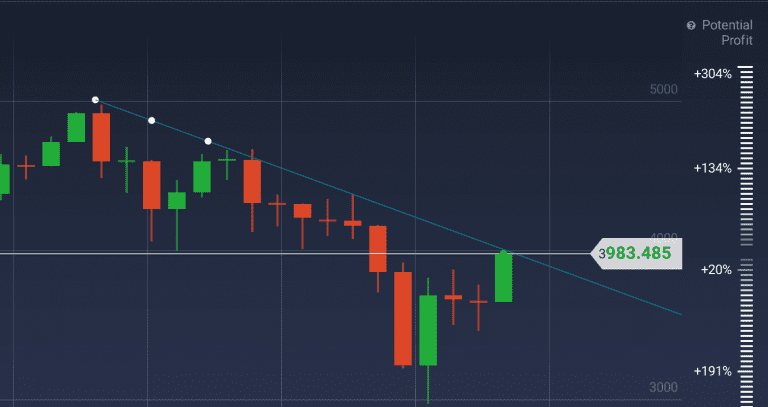
Something similar can be expected to happen in the future, with major psychological levels set at $3,000, $4,000 and $5,000. Should the price action of Bitcoin break the resistance line from below, it can continue to ascend. Otherwise, the price action can be expected to crumble even lower and test the $3,000 support. The long-term trend, displayed as a 50-period Simple Moving Average, demonstrates slight negative movement.
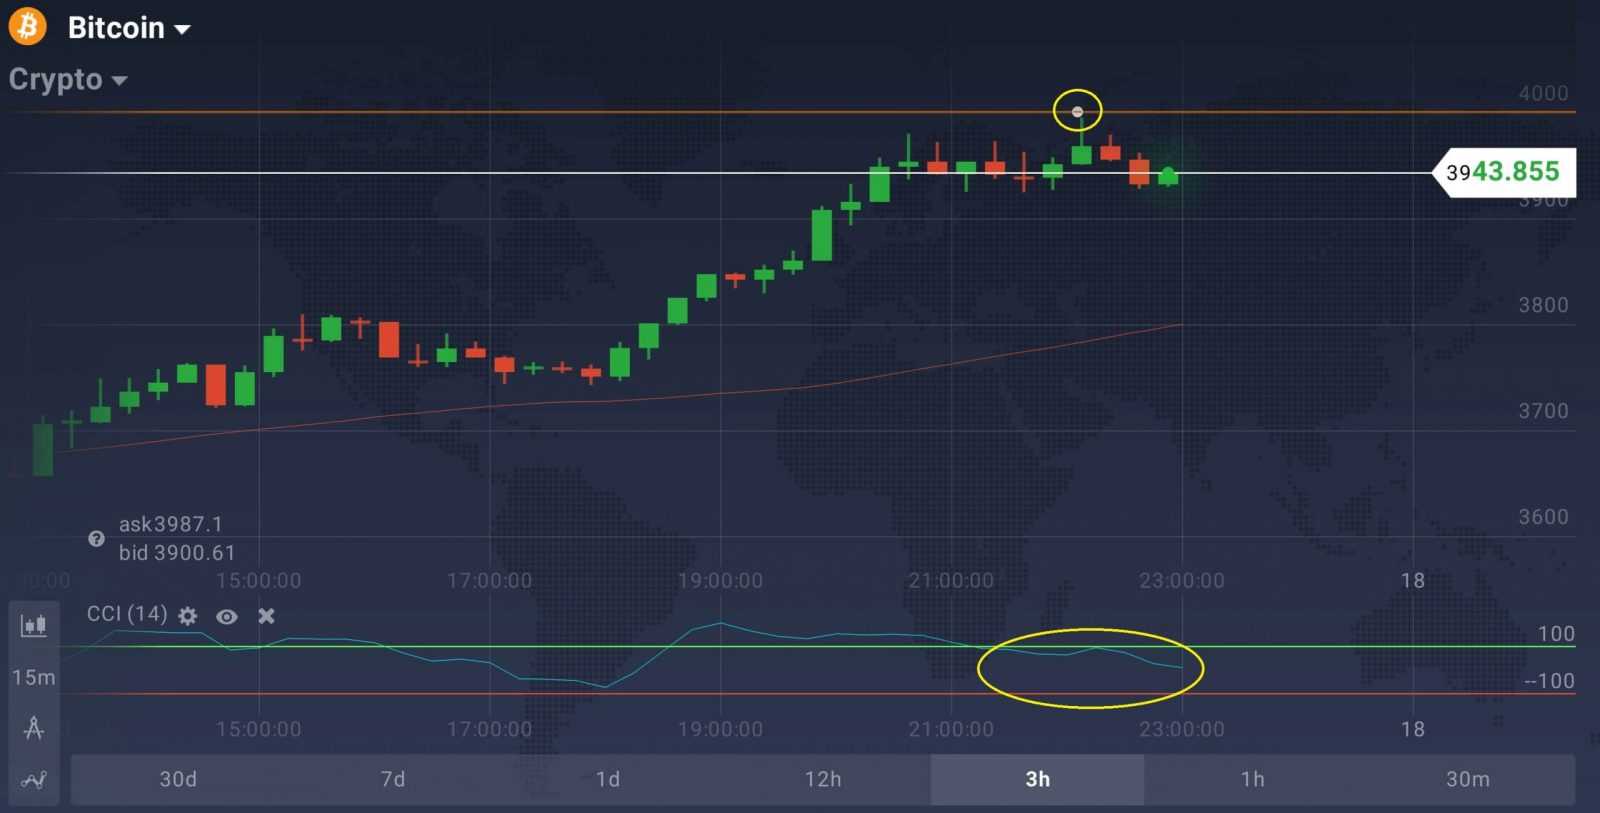
When taking a close-up, it can be noticed that the price of Bitcoin has almost reached the level of $4,000 but then started to go south once again. The Commodity Channel Index (CCI) demonstrates the lack of further growth potential.


