The number of strategies that employ the use of breakouts is truly impressive. However, it is not always possible to monitor the price non-stop with the sole purpose of spotting the breakout. Even when it is possible, it is quite easy to miss the right moment to actually open the deal. Quite often traders who closely follow the price in a tight range don’t open the deal at the most suitable moment. The reason for that is simple: the price usually leaves the price range as a result of a sudden and powerful price move. The moment you spot this move the opportunity is already gone.
Some traders try to chase the move when it has already happened — usually with detrimental results. It turns out that trading breakouts is not always easy. The following strategy combines the breakout with the use of a particular candlestick pattern in order to address this exact problem.
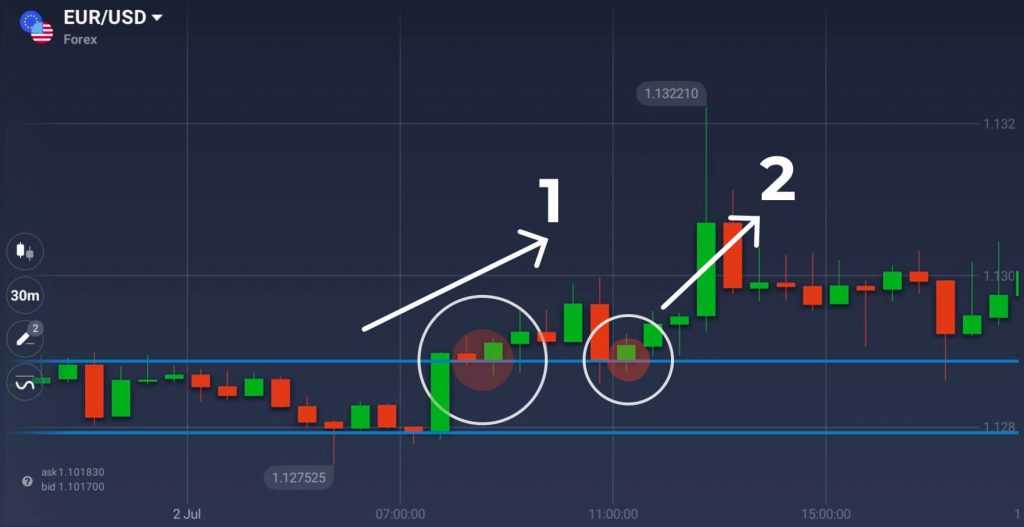
On the screenshot above you can see a setup that is used to trade pop n’ stop strategy. It has several distinct features:
- The asset is traded within a tight range,
- The price swiftly leaves the established range and then falters,
- A new support level is formed.
You should consider trading according to this strategy only if all of the above is present. Otherwise, the conditions are not met, and risks associated with the use of the following tactic increase manifold.
How to trade this pattern?
Sometimes the asset is traded in a narrow price range. It can happen due to several reasons. In fact, for the purpose of this particular strategy, it doesn’t matter what makes the asset trade in a range. The presence of the range itself is enough. The next thing that has to happen is a swift breakout, followed by a slowdown in the price action or a complete stop. From now on, all candles have to close above a newly formed support level, that has previously acted as a resistance level.
What are you supposed to do when you spot a combination like this? First, think about risk management. As one of the tools to manage their risks, traders utilize stop-loss orders.
There are two possible stop-loss levels that seem most logical for this set up. Conservative traders set their stop-loss orders at the closing price of the first green candle above the newly formed support line. Aggressive traders may choose the level of the support line itself. Situated lower, it gives enough room for the price action to move both ways.
The trader then opens the BUY deal when a confirmation is received. What is a confirmation in this case? Two green candles that close consecutively above the support line (as in our case) can be considered a confirmation. Another entry point is when the price goes back to the support line and bounces up. Again, a confirmation is required to minimize the risks involved. In any case, the support line is the tool that you use to identify possible entry points.
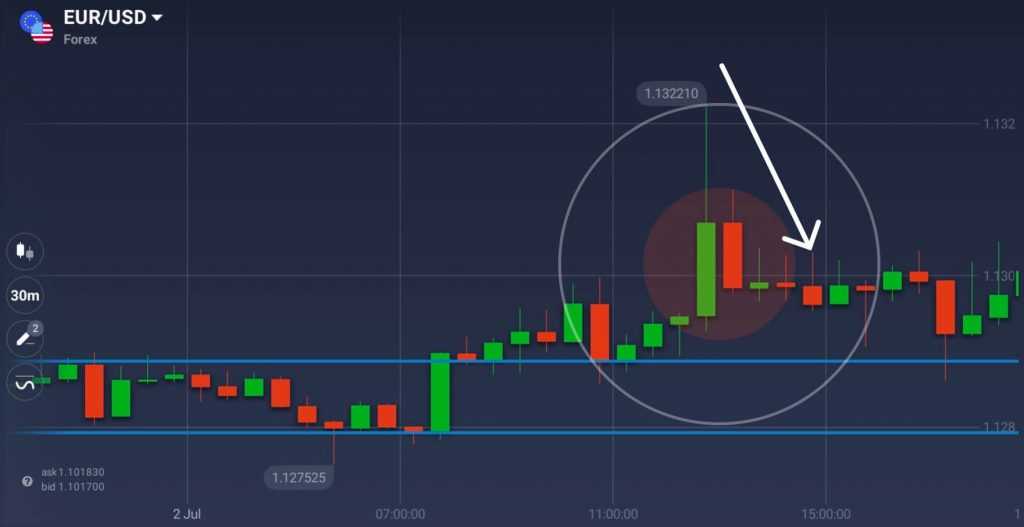
Likewise, you can trade the same setup in the opposite direction. In order to do so, you can wait for a significant upward movement and after the first negative candle that follows it, open a SELL position. Stop-loss is located on the reversal point and won’t let the price get too high.
Conclusion
There are several things you should consider when working with this strategy. First, it is generally considered to bear a high degree of risk. Therefore, you might want to try it on a demo account first, before you put real money at stake. For the same exact reason, the use of confirmations is essential.
Secondly, upcoming news and announcement can significantly affect the asset price, sometimes in unexpected ways. Consult the economic calendar before engaging in pop n’ stop trading.
Whether you are going to use this strategy or not it is definitely worth learning and trying. And remember that no matter what strategy you use, it cannot provide accurate signals 100% of the time.


