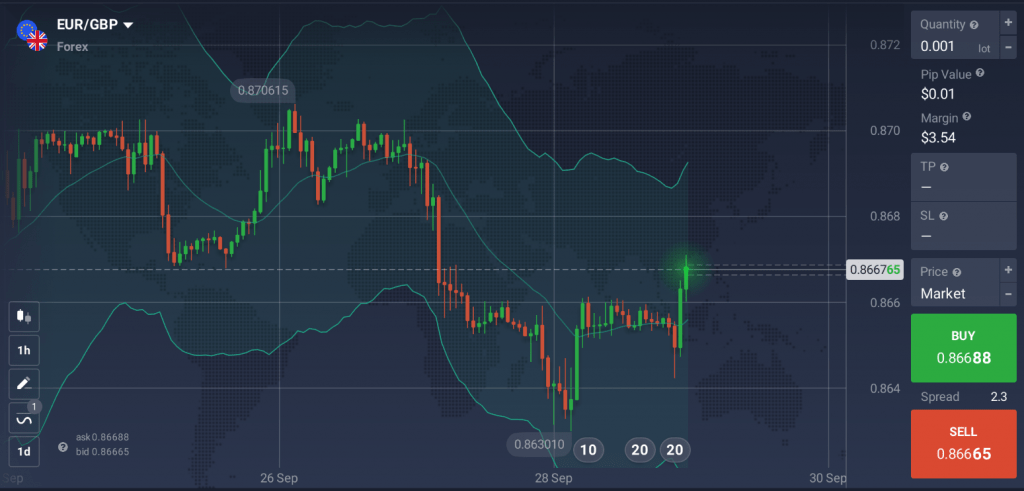
Often underestimated, the Keltner Channels (KC) indicator is one of the new trend indicators on the IQ Option trading platform that may remind you of Bollinger Bands. Indeed, it is a similar concept. However, it has its peculiarities, so let’s take a look at Keltner Channel Indicator settings and figure out how it may be used in trading.
What is Keltner Channels Indicator?
The Keltner Channels is an envelope indicator, which means that it has upper and lower bounds, plotted around the chart with the purpose of defining the overbought and oversold levels.
While Bollinger Bands are based on a standard deviation, Keltner Channels uses the Average True Range (ATR) to set the channel distance, which allows for a more narrow channel and more precise signal. The standard settings imply two Average True Ranges above and below a 20-day exponential moving average (EMA).

Being a trend-following indicator, Keltner Channels can help define the trend reversal points and breakouts, as well as identify the overbought and oversold levels. The EMA defines the direction of the trend, while the two ATR values set the width of the channel, reflecting the volatility of the asset.
Keltner Channel Indicator Settings
To set up KC, find it in the Volatility tab of the Indicators section. You are free to adjust the settings according to your needs, though the indicator functions perfectly with the standard set up.
Now that the indicator is set up, you are ready to start using Keltner Channels. Proceed to the trading platform and give it a try.
How to trade Keltner Channels Indicator?
It is necessary to learn to read the indicator’s signals before you include it in your strategy. The principle is quite simple, once you get the hang of it. The Keltner Channels makes the trend clearly visible.
☝️
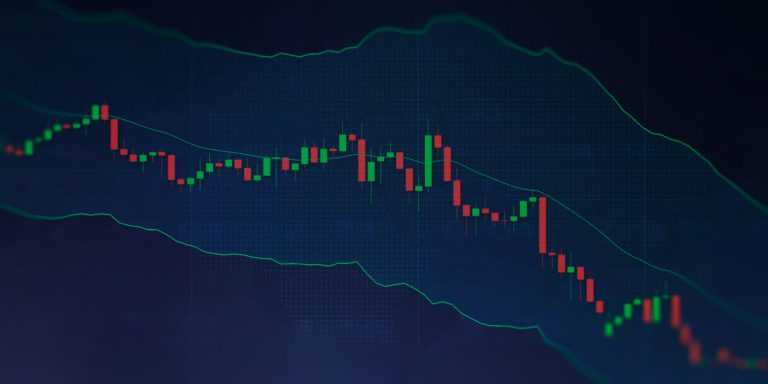
A <Sell> signal can be detected when the KC move lower and closer to the bottom line, occasionally crossing it. A surge below the bottom line indicates a strong downtrend.
When a channel moves sideways, the trend is flat.
A downturn or upturn with the following break below or above the bottom or upper line respectively can be considered a start of a new trend.
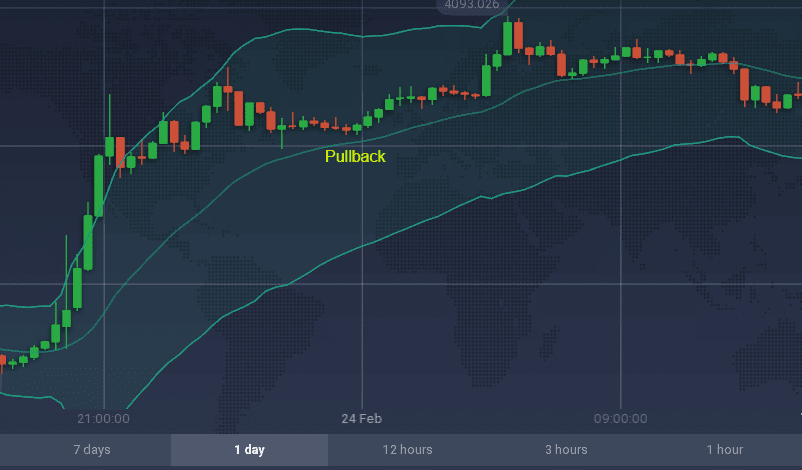
You may apply different strategies with the Keltner Channel indicator depending on your trading style. For instance, you may trade the <Pullback> strategy, placing long (<Buy>) trades when the price is in uptrend at the moment of the pullback to the middle line.

You may also place short deals (<Sell>) during the downtrends, when the price pulls back to the middle line. Another strategy is the <Breakout> strategy, where the main principle is to <Buy> if the price crosses the upper line and <Sell> in case the price breaks below the bottom line.
However, it is important to note that, despite being a helpful tool, the indicator is not guaranteed to provide accurate results 100% of the time. The KC indicator is a good pair to oscillators like ADX or RSI, which can help identify the best time to enter the deals.

