US retail sales grew much stronger than expected while prices for manufacturers continue to rise, a combination that will lead to FOMC interest rate hikes. On one hand the FOMC likes to see retail sales grow and would like that to continue; strong consumption equals strong economy. On the other demand for goods is high and that is leading prices for producers and consumers higher, a situation the FOMC can’t ignore.
Retail sales grew by 0.5% in July and is the first read on consumption for the third quarter of 2018. The data is 0.4% above expectations but offset by a downward revision to the previous month. The June figure was revised lower by 0.2% to 0.3% which leaves this month’s net change of +0.20% well above estimates. On a year over year basis retails sales are up more nearly 6.5% and driven by strong gains in retail, non-store retail (ecommerce and other) and gasoline sales which are up 22% on rising prices.
The Empire State Manufacturing Survey shows robust growth in the US economy manufacturing economy. The survey diffusion index rose 3.0% to 25.6% on strength in shipments, new orders, unfilled orders, hiring and longer work-weeks. Regarding prices, the prices paid index was virtually unchanged from the previous month but remains high and consistent with steady increases in cost.
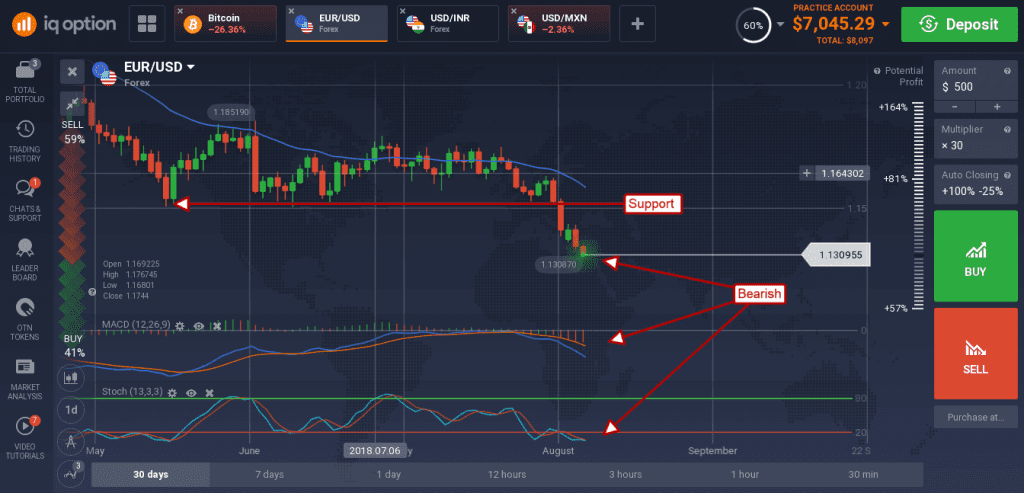
The EUR/USD held steady on the news but is trading at a freshly set one year low. This low is a continuation of the downtrend that has dominated the pair since early spring. Based on the weekly activity the pair if moving lower after confirming a bearish flag/flat-bottom triangle and headed lower. Projections for this move are as low as 1.1100 and likely to be reached over the next four to eight weeks. There is a host of data due out on Thursday and Friday from the US including the Philly Federal Reserve’s Manufacturing Business Outlook Survey and the Index of Leading Indicators that could send this pair lower.

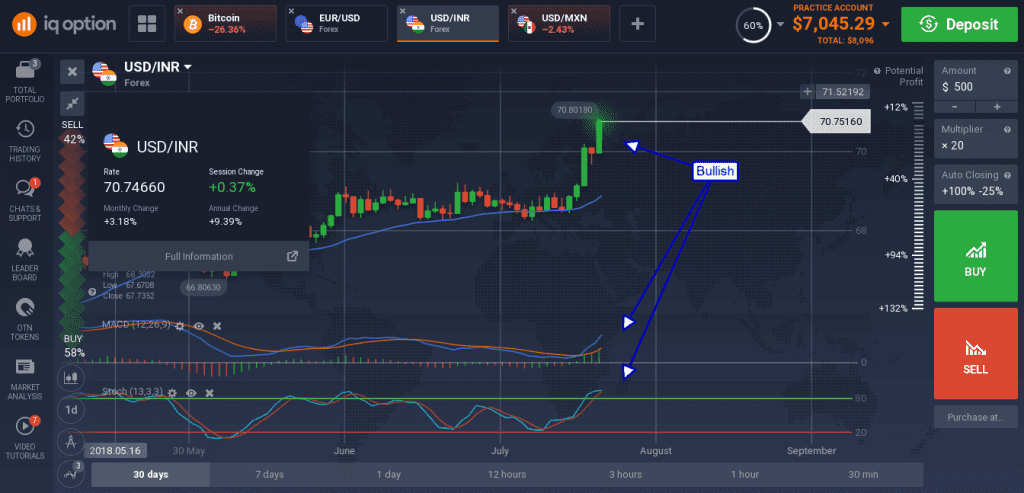
The USD saw significant gains versus the ailing Indian Rupee. The pair is being driven by the double-catalyst of US economic strength and trade disputes with the US. The USD/INR broke out of its consolidation range last week and was pushed higher on today’s US data.

The pair is supported by the indicators which are both bullish and showing strength. Projections for this move are between 69 and 71 Rupees per USD which leaves some room on the table for savvy traders.
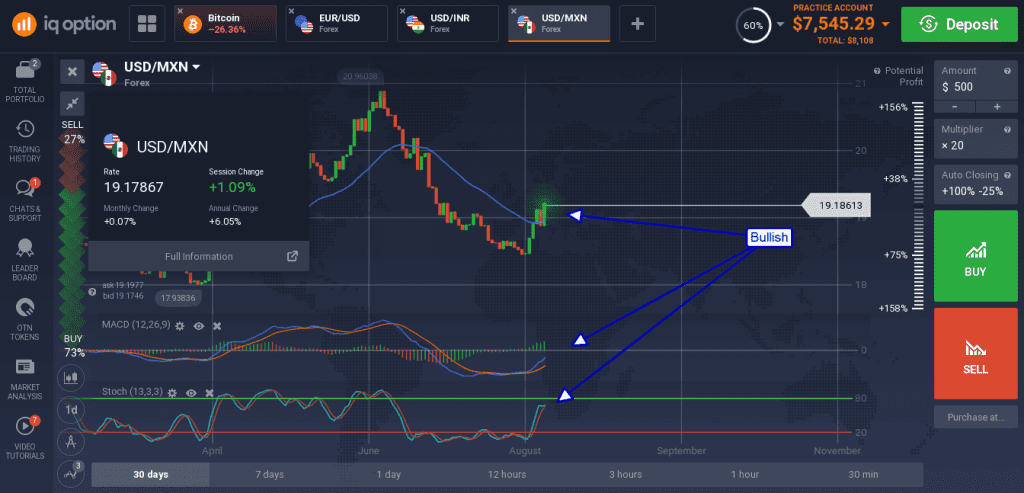
The USD also saw strong gains versus the Mexican peso and looks like it will move higher.

The pair formed a large green candle confirming support at the recently broken short-term EMA and is supported by the indicators. A move up is likely to hit 19.50 in the near term and possibly higher over the next two to three months.
