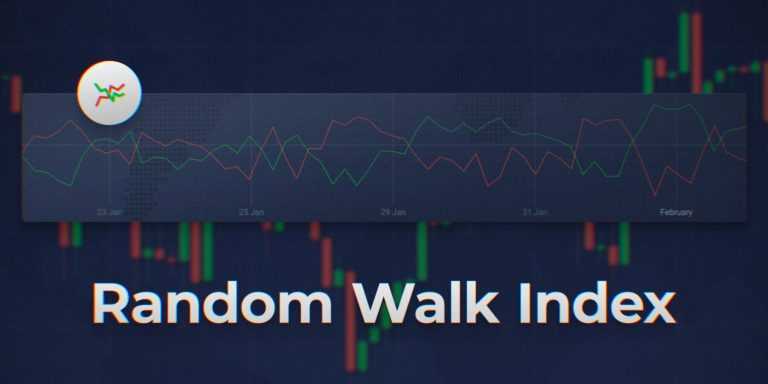
Certain indicators can help you determine the direction of the price change (which is not always that obvious). Random Walk Index (RWI) is even more specific. It might help you determine whether the price movement is random or is a part of a bigger trend.
You have probably heard more than once that “the trend is your number one friend” and that you should “trade with the market, not against it”. With the help of Random Walk Index, it might be easier to determine the real direction of the price change and follow it, if you decide to do so.

Developed specially for the stock market, this indicator is now used for all asset types and all time frames.
How does it work?
Random Walk Index is basically a combination of two lines: the red, which is responsible for the strength of the downward movement, and the green one, that corresponds to the strength of the upward movement. There are also several levels — horizontal lines marked as 1, 2 and 3. When green and red lines fluctuate around ‘1’, most price moves are possibly random. When either of the lines moves above ‘2’, the price action might be attributed to a trend. When one of the lines crosses ‘3’ from below, a particularly strong trend could be observed.

The indicator is easy to read (which doesn’t necessarily mean that it is easy to trade with). The higher one of the lines goes, the stronger the current trend — positive when the green line is rising, and negative when the red line is up. RWI might, therefore, help you determine not only the presence of a trend, but also its strength. However, this indicator doesn’t provide any information on its duration.
How to use it in trading?
There are two ways to apply the Random Walk Index.
First, you could use it as a self-sufficient analysis tool. In this case, a trader may consider opening a BUY position when the green line is above 1.5, and the red line is below 1. And SELL position when the red line is above 1.5, and the green line is below 1. All moves below 1 are attributed to random price fluctuations.

Secondly, you might make Random Walk Index a part of a more complex trading system. You might want to combine it with a momentum or a volatility indicator. Moving averages (and their derivatives) also work quite well. In this case, you can use RWI as a supportive tool that will confirm/refute signals sent by other indicators. The second strategy will generally mean that you receive less signals but of higher quality.
It is worth knowing that the Random Walk Index is a lagging indicator. After a particularly strong trend, it will still point to its prevalence, even when the former has already ceased to exist. Consider this when using RWI on its own.
As mentioned earlier, RWI won’t help you estimate the duration of the trend. But there is one trick: as a rule, stronger ones take longer to fade away. And Random Walk Index is perfectly capable of determining the trend strength.

As any other indicator, RWI cannot provide accurate signals 100% of the time, no matter how good you get at using it. Keep this in mind when using it.
How to set up?
Setting up Random Walk Index is easy:
- Click on the ‘Indicators’ button in the bottom left-hand corner of the trade room,
- Go to the ‘Trend’ tab and choose Random Walk Index from the list of available indicators,
- Click the ‘Apply’ button without changing the settings.
The indicator is ready to use!
Please note that according to Michael Poulos, the man behind this indicator, it is best suited for short-term deals when the number of periods is between 2 and 7, and for long-term deals when the number of periods is between 8 and 64.
Now, when you know how to set up and use Random Walk Index to tell the trend from random price movements, you can proceed to the platform and give it a try. Who knows, maybe it will become a valuable addition to your tech analysis.


