Ever feel like your trading strategy could use an extra spark? Enter the Relative Vigor Index (RVI), the technical analysis tool that’s like a double shot of espresso for your trading decisions. Just as we tend to get more energetic when things are looking up (or after that first cup of coffee), asset prices tend to close higher in uptrends. Let’s dive into how the RVI indicator can help you spot these energetic market moves!
What Exactly Is the Relative Vigor Index (RVI)?
The Relative Vigor Index or the RVI indicator is a momentum oscillator used to assess the direction and strength of a market trend. It works by comparing an asset’s closing price to its trading range. Then it smooths out the data using a simple moving average (SMA). The RVI’s magic lies in its ability to capitalize on a well-known market tendency: during uptrends, prices often close higher than they open, while the reverse happens during downtrends. By honing in on this behaviour, the RVI helps traders get a clearer picture of market momentum.
How to Use the Relative Vigor Index (RVI)?
Traders may anticipate that the RVI value will increase as a bullish trend goes up. In this optimistic scenario, an asset’s closing price can get closer to the top of its trading range, while the opening price stays closer to the bottom. Essentially, when the market is trending upward, prices tend to finish stronger than they start, and the opposite is true during downtrends.
Much like other oscillators, such as the MACD or the RSI, the RVI fluctuates around a centre line. This means it’s usually displayed above or below the price chart, swirling around a central point rather than tracking the exact price movements. Understanding this distinction is key to effectively using the RVI in your trading toolkit.
Crafting a Relative Vigor Index Strategy
There are different ways traders can use the RVI indicator to understand market trends and look for possible entries. However, the two most popular approaches are searching for divergencies and spotting crossovers. Let’s look at each method separately.
RVI Divergence
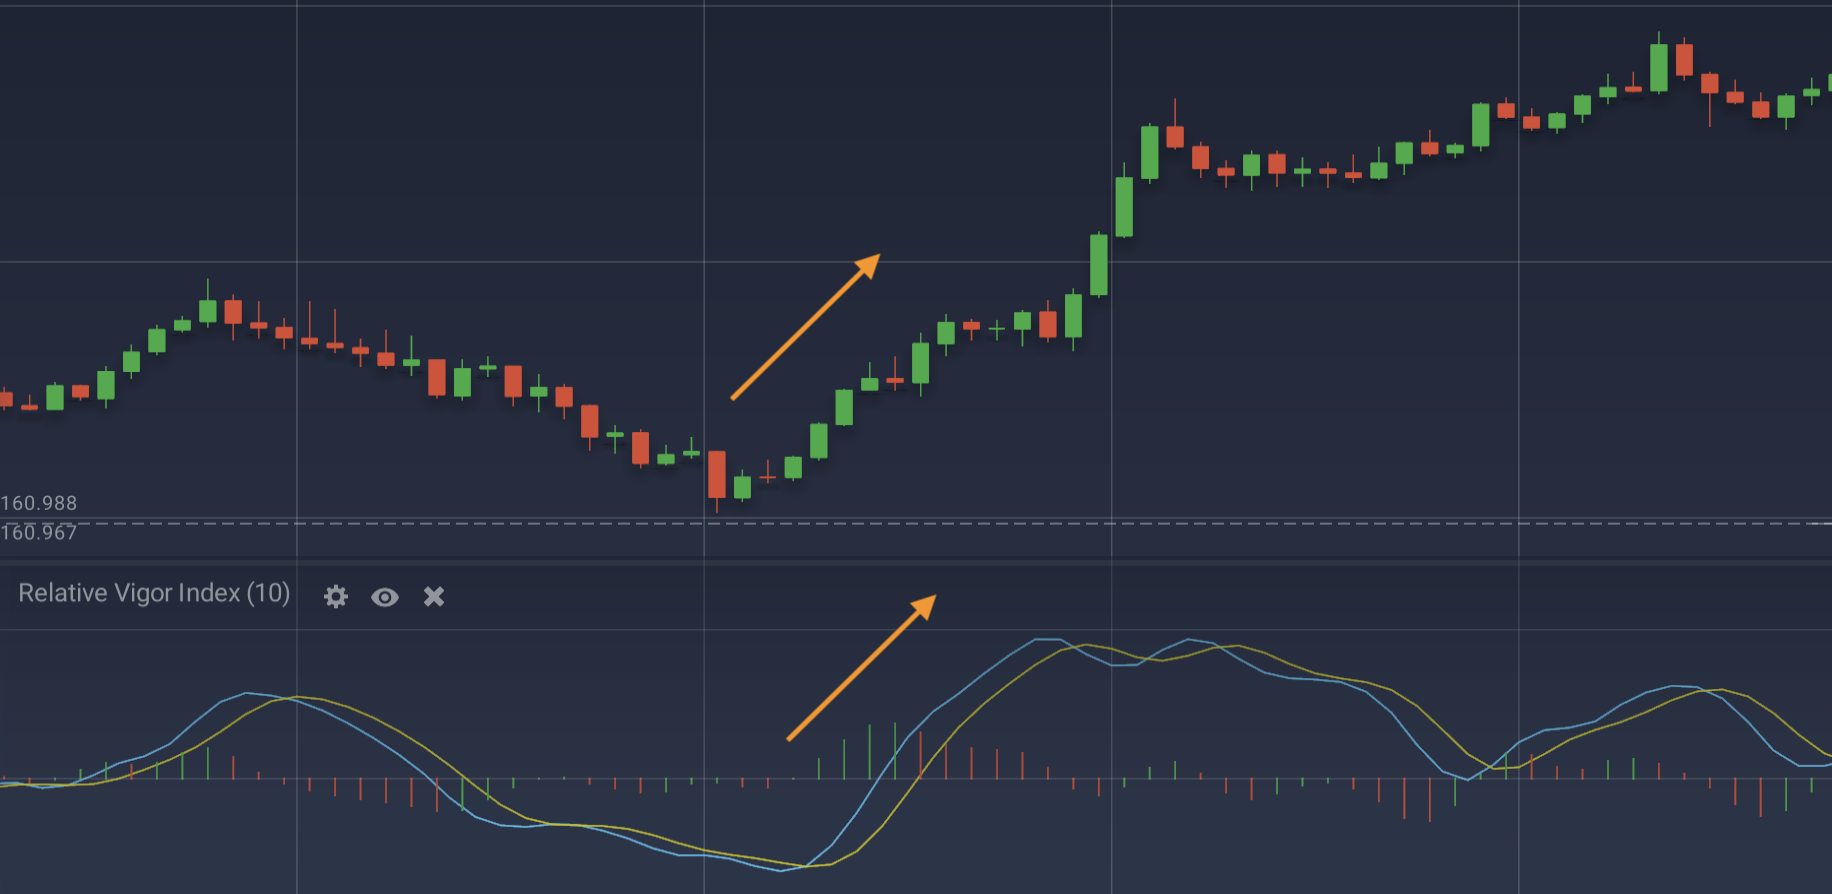
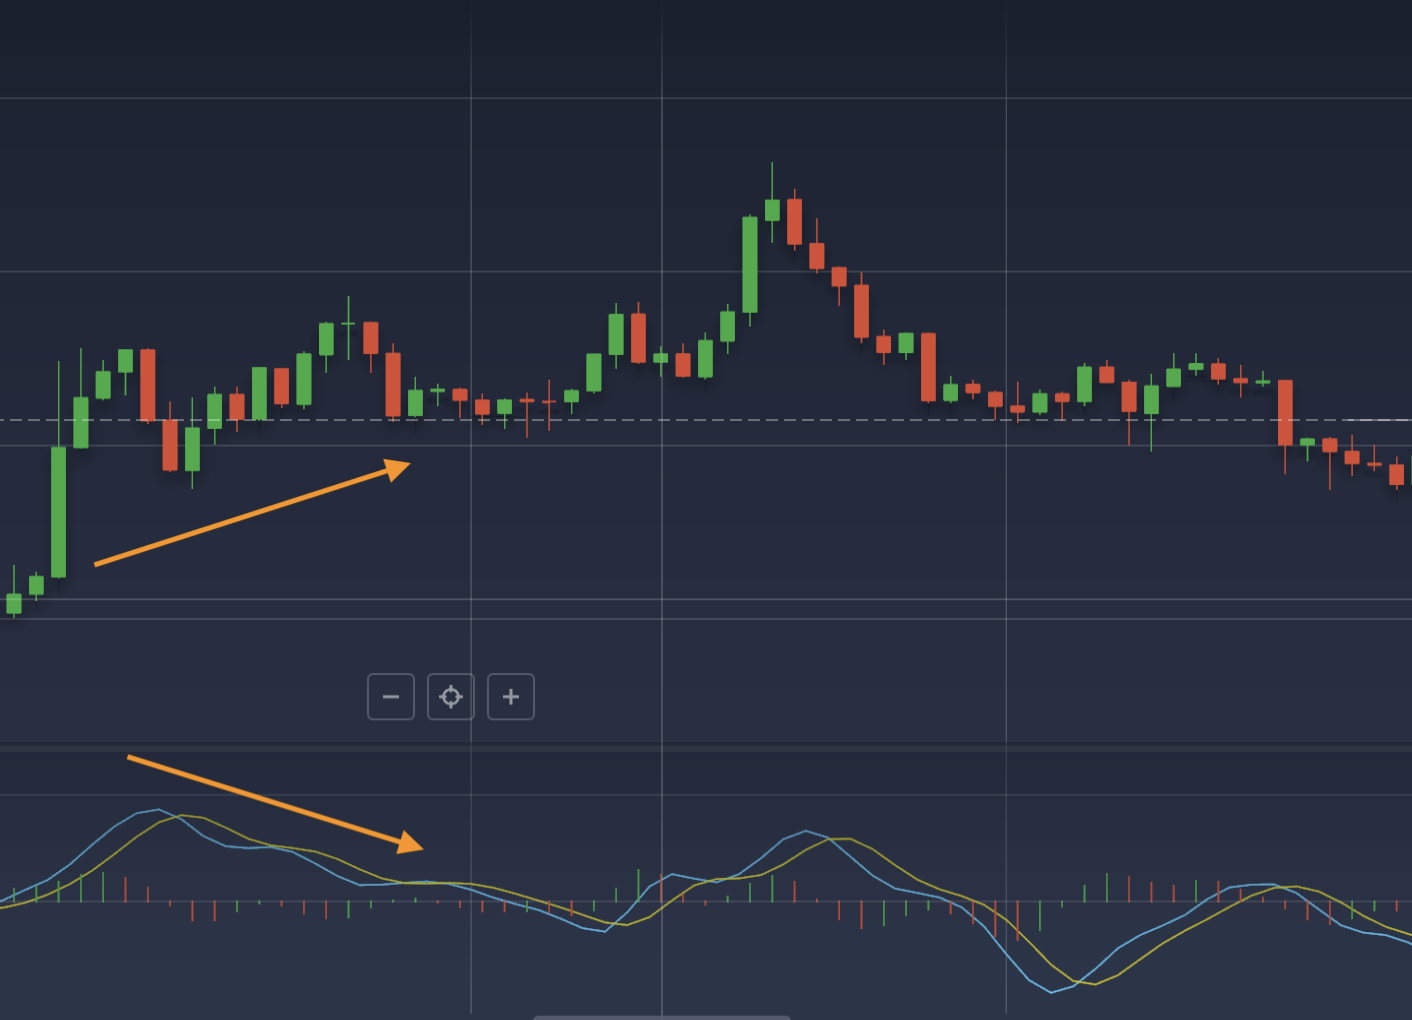
When the RVI indicator and the price move in opposite directions, it hints at an impending trend reversal in the direction of the RVI. For example, if an asset’s price is climbing but the RVI is declining, it’s a signal of a possible upcoming reversal.
As a leading indicator, the RVI often hints at trend changes before they become evident in the price itself. When the RVI’s movements diverge from the asset’s price action, it’s a sign that a trend change could be on the horizon.
RVI Crossover
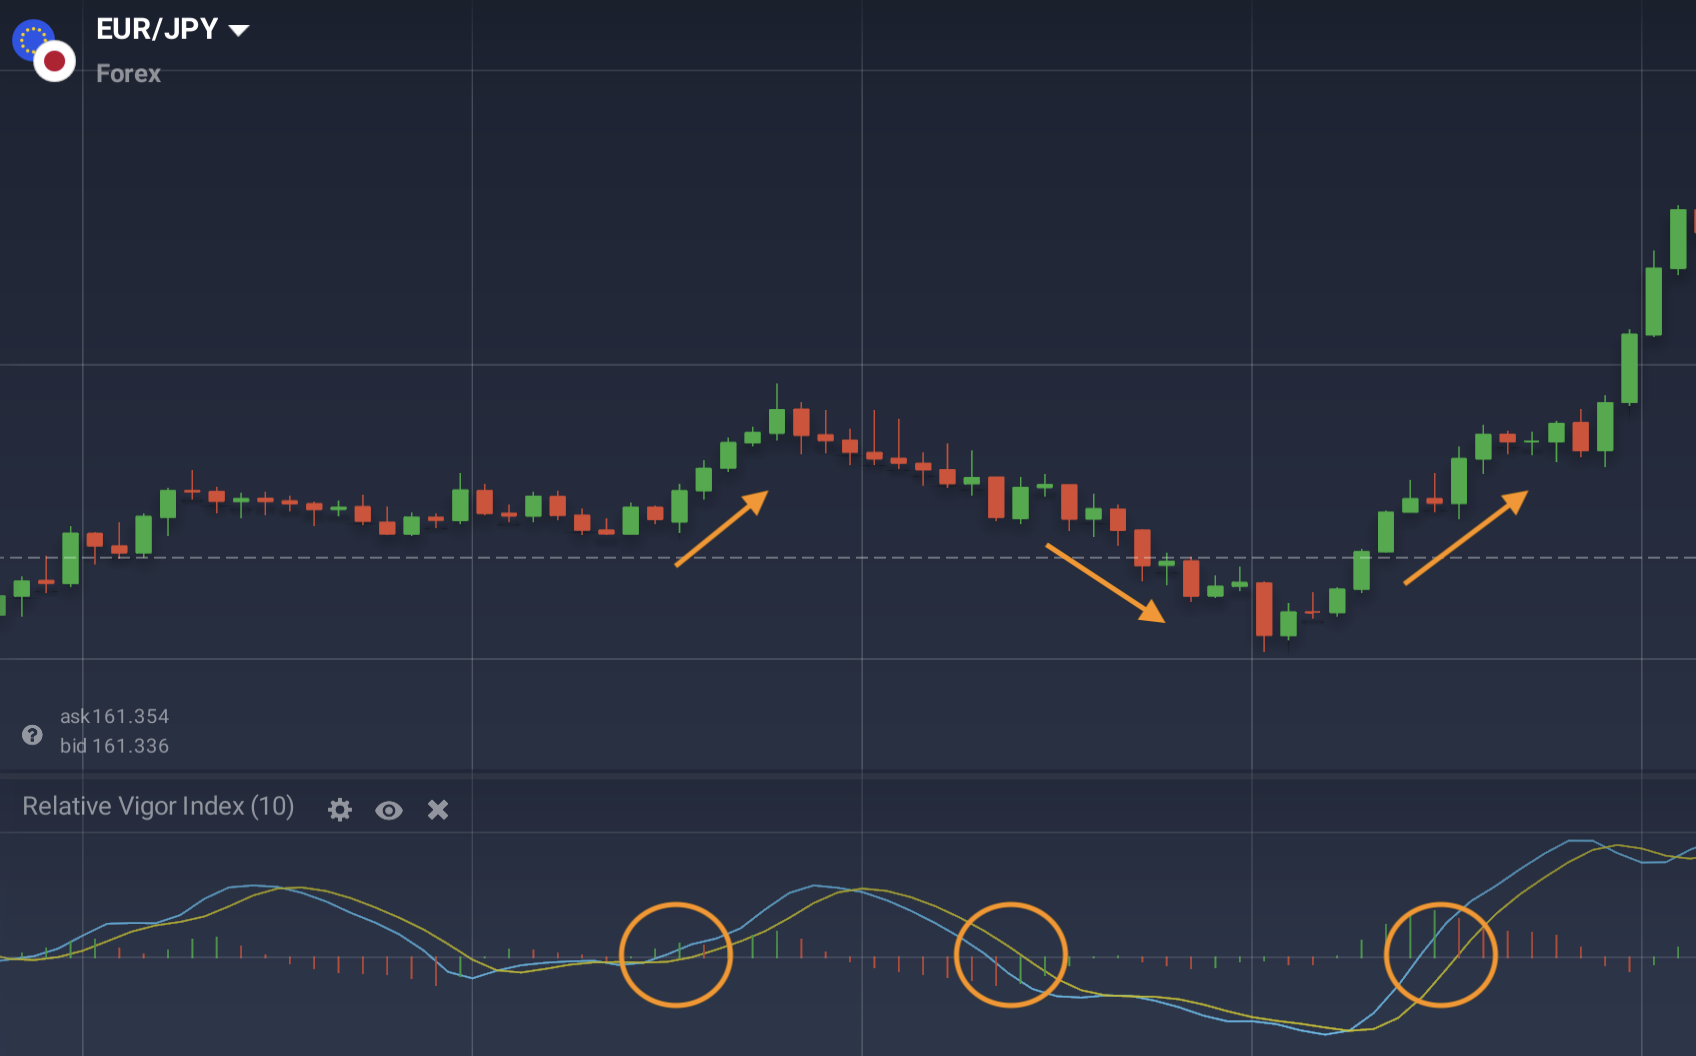
When the RVI line crosses the centre line, it’s called a crossover. In case the RVI line moves above this centre line, it suggests a bullish trend. Conversely, a crossover to the space below the centre line indicates a bearish shift. These crossovers can serve as early warnings of where the price might be headed next.
With the Relative Vigor Index in your trading arsenal, you can add a little extra vigor to your market analysis and stay ahead of the curve. Whether you’re spotting divergences or tracking crossovers, the RVI provides valuable insights that can help you fine-tune your trading strategy and navigate the market with greater confidence.
Relative Vigor Index (RVI): Best Settings
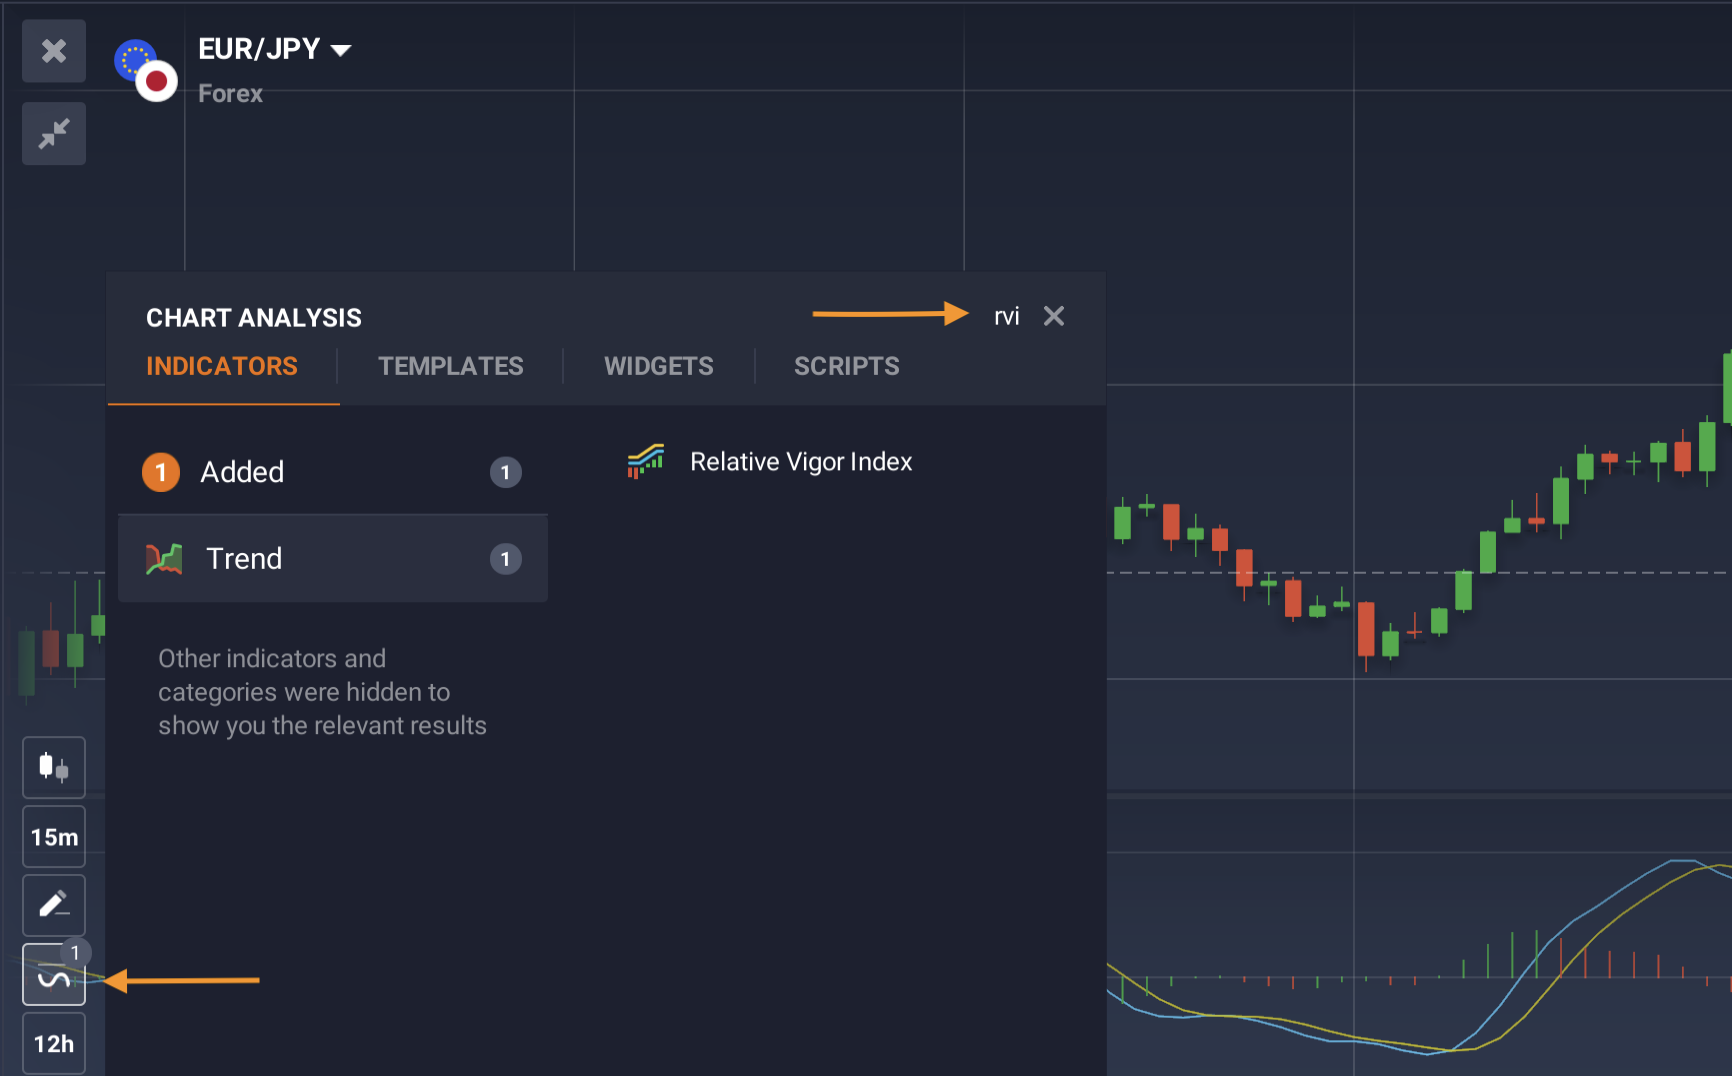
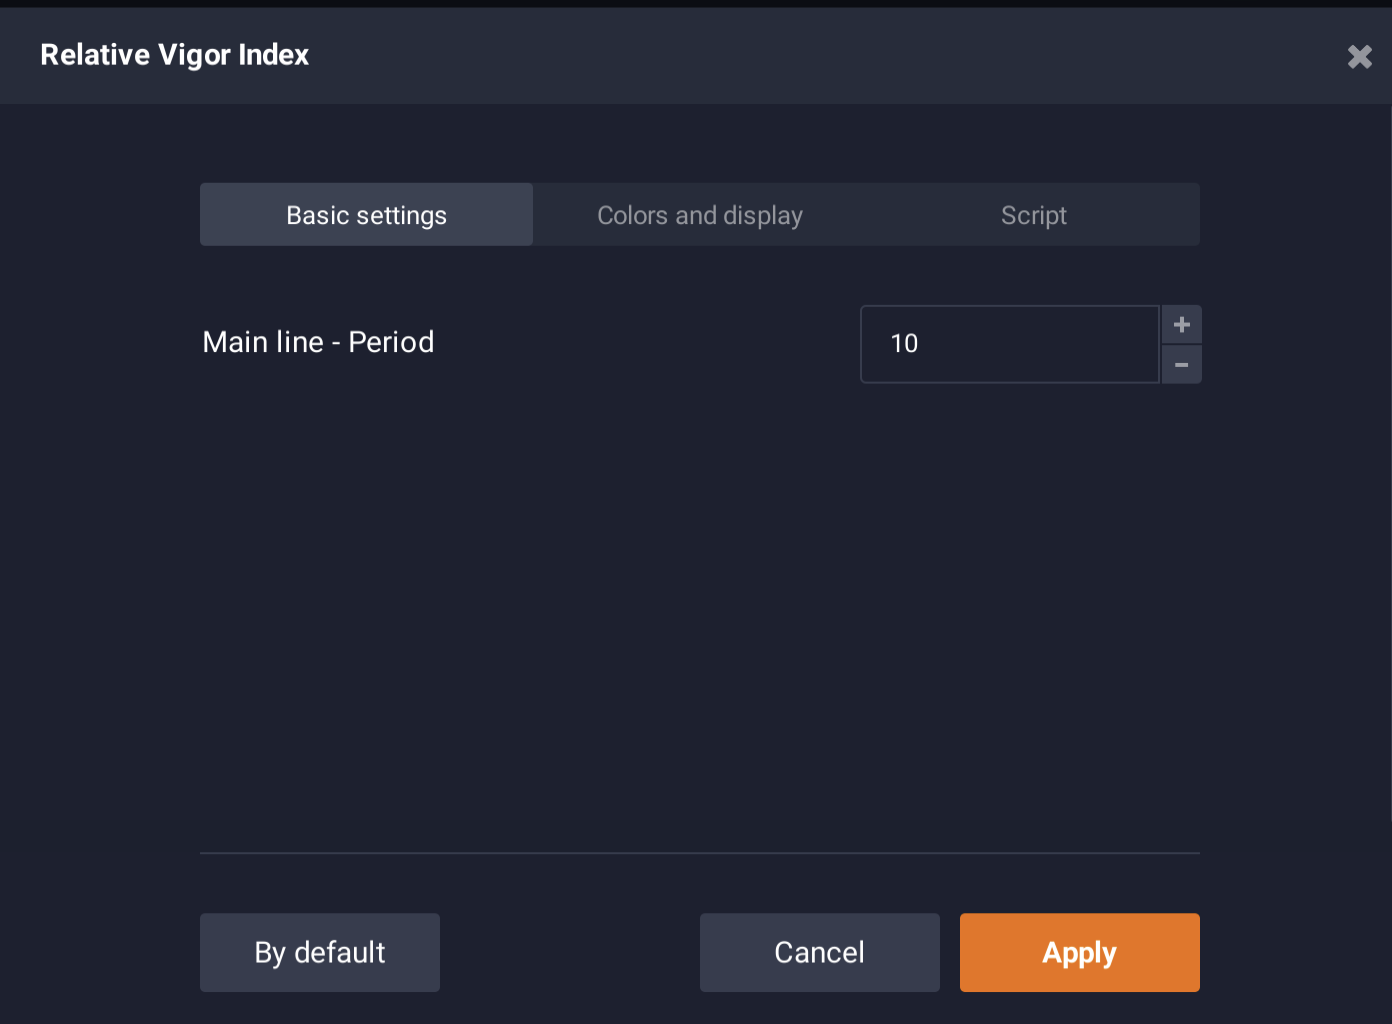
To enhance the accuracy of the RVI, traders might consider extending the period settings. This adjustment minimizes the impact of short-term fluctuations, allowing the RVI to focus on the bigger picture and provide more reliable signals. You can check and pick the suitable settings in the IQ Option traderoom and apply them directly to the price chart. To do this, go to the ‘Indicators’ section and type in ‘Relative Vigor Index’ in the search box.
Relative Vigor Index (RVI) vs. RSI
Some indicators, especially those in the same group of tools, might have similar characteristics. For instance, some may confuse the Relative Vigor Index (RVI) with the Relative Strength Index (RSI). They are not only spelled similarly, but also belong to the same group of indicators called oscillators. However, there are a few key differences to consider when choosing between these tools.
☝️
You can test different indicators to find the optimal solution for your trading strategies. Experienced traders even go as far as to combine several technical tools to improve their readings and get more precise signals. Take your time, test different tools and create your own unique trading toolkit that will bring you to the top of the trading world!
