
OMG had a rollercoaster ride the past week. With weekly highs and lows ranging from $8.7 and $6.9, the price gradually ended up at its weekly starting value and is currently trading at $7.7 against USD.
Key Highlights
- Multiple bearish trends were compensated with significant upward rallies
- Support at $6.9 and $7 acted as a pivot point, but strong resistance at $8.6 did the same
- OMG/ETH had a good performance as it gained 13%, with current trading value at 0.0261 ETH
Considering the weekly chart first, we can see three bearish trend line along with a 24-hour steep bullish line. Support levels at $6.9 and $7 gradually reversed the trend to a bull, but strong resistance above $8.6 resulted in a bearish trend which is stabilizing gradually.
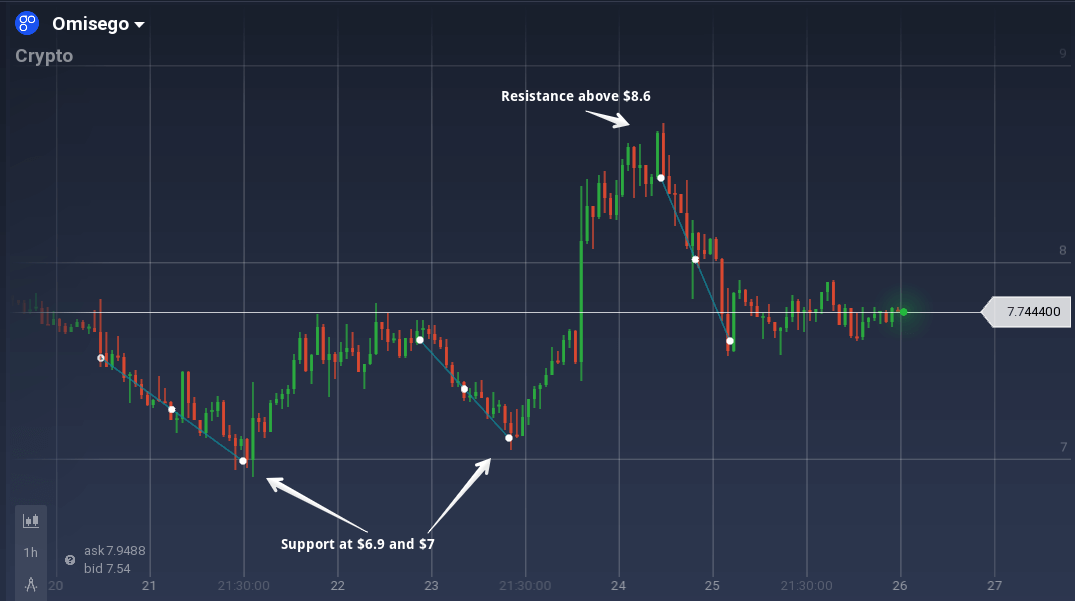
Moving to the 24-hour chart, the price is moving within a very narrow band between $7.9 and $7.6 with resistance and support at the respective levels. But the 12-hour chart is indicating an upward movement even though for a short term.
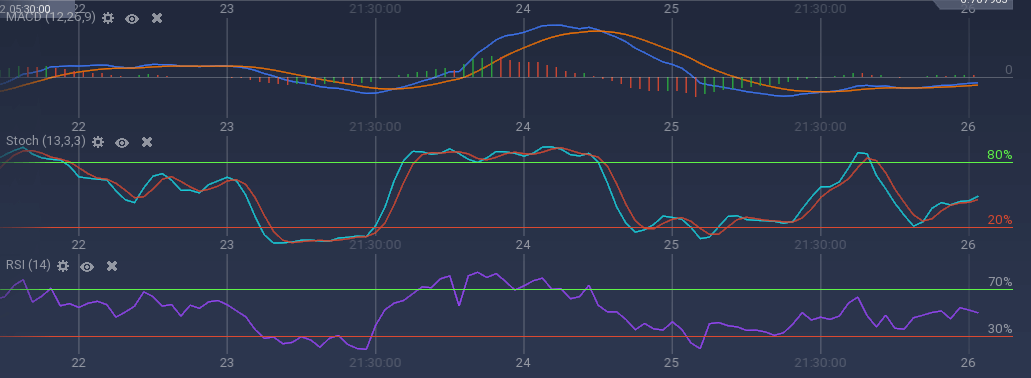
The statistical tools and oscillators are also indicating a positive movement. Though MACD curves are moving flat for a while, it is moving with a slight upward tilt and the Stoch is also indicating an upward movement.
Against ETH, OMG had a good performance week-on-week. A gradual upward trend took the value 13% higher than the week start and is now trading at 0.0261ETH.
Well, OMG had a firm backing the token. Even though OMG didn’t perform well when compared to its ICO performance, it seems it is gaining the trust of the traders gradually.
