There are different sources of information that asset prices incorporate to produce abnormal movement, or volatility: macro- and microeconomic reports, political news, public information etc. Traders use such information to their advantage to enter or exit the market in time so they enhance their trading strategies, but how can you do it? How do you choose when and what to read and use? Read on to find out.
Market analysis tab
The IQ Option platform offers you a built-in Market Analysis tab with all the news and information you might need to cover the fundamental analysis aspect of trading. Here’s how to find it:

When you click on this tab, you will be given all the different markets that you can read about and find more information on: Forex Calendar, Earnings Calendar and Crypto Calendar. You will also find a section with the most popular assets at the time and relevant articles. Each article will show you the number of viewers who read it, and the general sentiment of the market. Here’s how it looks:

Forex calendar
The Forex calendar will show you the different macroeconomic reports that are released on a weekly/monthly basis, and other follow-up press conferences, meetings, summits concerning the different currencies we have on the platform. Each individual report will show you what currency pairs will be affected when it’s released, the previous and current forecast and also the level of importance (1, 2 or 3 dots.) Make sure you check the time and date of the report and the time zone of your platform matches your own time zone.
Earnings calendar
Earnings are financial statements released by publicly-traded companies on a quarterly basis. Our earnings calendar shows you past and future earnings reports releases, similar to the Forex calendar. The importance of these statements lies in the transitory movement produced after their release — these reports are either released before market open or after market close.
You may access this calendar to find which earnings report will be released, or which one has already been published. You might look at the forecasts (current and previous) and also the change that the asset has had over the last 24 hours. This is how it looks:

Crypto calendar
In a similar fashion, the crypto calendar lists the different meetings or relevant summits that determine the future of each or all cryptocurrencies, ranking them in importance with the same dot-measurement and a link in which you can find more relevant information. The reports will show the logo of each crypto involved in the said report and it will also be clickable so you can easily open the crypto chart.
Choosing asset instead of news
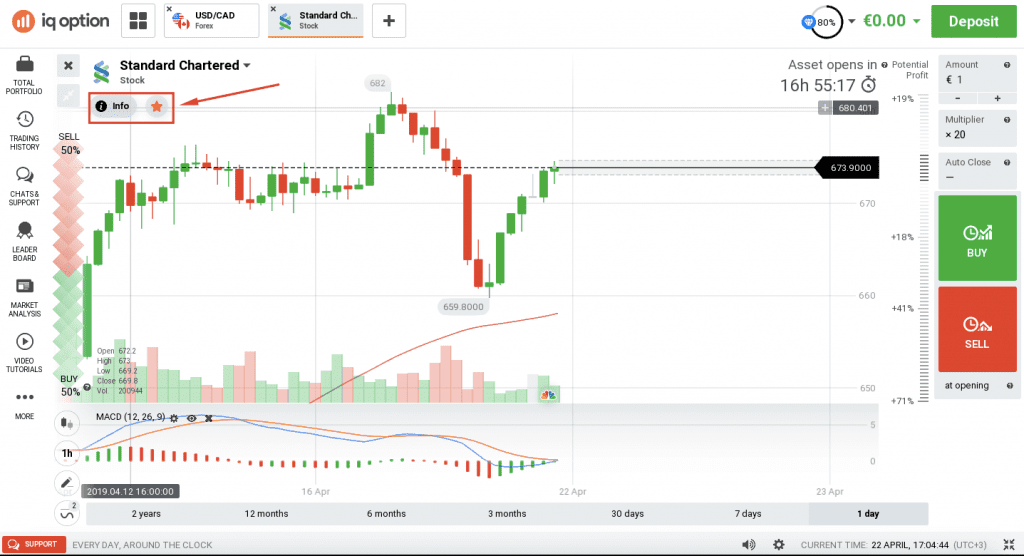
When you choose an asset, you can access it, then just under the asset name, access the Info tab which will direct you to relevant updates and information on the asset of your choice. The tab looks like below:
The Info tab for each asset shows information on news articles with embedded text so you do not have to leave the platform, Earnings Calendar should you select a Company to trade on, and Trading conditions listing Trading Schedule, market conditions such as overnight rates, spread and multipliers and session change. You will also be able to find a traders’ sentiment on the asset of your choice and other important information to enrich your vocabulary in each asset you decide to trade on.
As an example to implement what we have learnt we will be using a Forex event happening today. The said event is the European Central Bank’s Interest Rate Decision today at 14:45 GMT +3. The European Central Bank presented dismal projections for the future of the Eurozone economy on March 7th, 2019 when they previously released this same report and monetary policy statement. Their decision to leave the Interest Rate unchanged at 0.00% in March pushed EURUSD down right after the news became public. This is how it looked:

Investors are expecting a similar outcome after today’s report, when the ECB might leave the interest rate unchanged and pinned at 0.00% again, which is the forecast. However, you should not that past performance is not an indicator of future performance, hence there is not guarantee the same results will apply 100%.
Webinars
You could also watch our recent webinar specially made for IQ Club members exploring our Market Analysis tab and how to use it. There is also a demonstration of all this information right on your favourite trading platform! You can find the replay of Tuesday 9th April 2019’s webinar here.
Information regarding past performance is not a reliable indicator of future performance.


