
There are many indicators on the IQ Option platform, and we frequently discuss the most popular ones, as they are generally easier to understand and widely used by traders. However, there are plenty of indicators that are a bit more advanced and tailored to certain needs of particular traders. Today we will talk about one of them — the Linear Regression Slope indicator. Though it does suggest a slightly more complicated structure, it is not hard to figure out, so let’s break it down step by step.
How does it work?
The Linear Regression Slope is a statistical tool, which means that it uses past performance to help predict the future price fluctuations. It is an oscillator that smooths the chart data with a moving average of the chosen period and forms regression lines ending at each bar, using the regression period specified.
The indicator measures the direction, as well as the strength of the trend. It consists of the indicator line that oscillates about the base line of 0 value. When there is an uptrend, the slope is generally positive and moves above the 0 point. When the asset is in a downtrend, the oscillator signals it by sloping below the base line. Periods of a strong trend can also be spotted in the rapid movements of the indicator.
However, it is important to note in such a case that past performance cannot always be an indicator of future performance.
How to use Linear Regression Slope in trading?
Traders may use the Linear Regression Slope indicator to define the direction of the trend, as well as its strength.
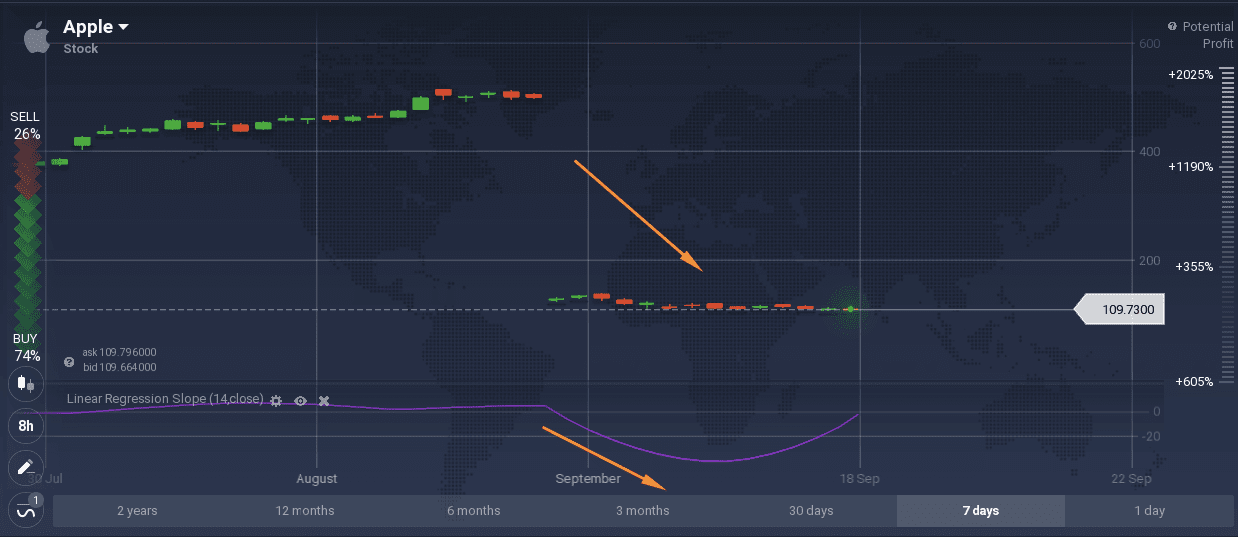
In the example above it is shown how the sharp drop in price is reflected in the indicator’s movement. At the moment of the drop the indicator falls below -20, later on the trend is still negative, however less strong and the indicator returns to above -20 but below 0.
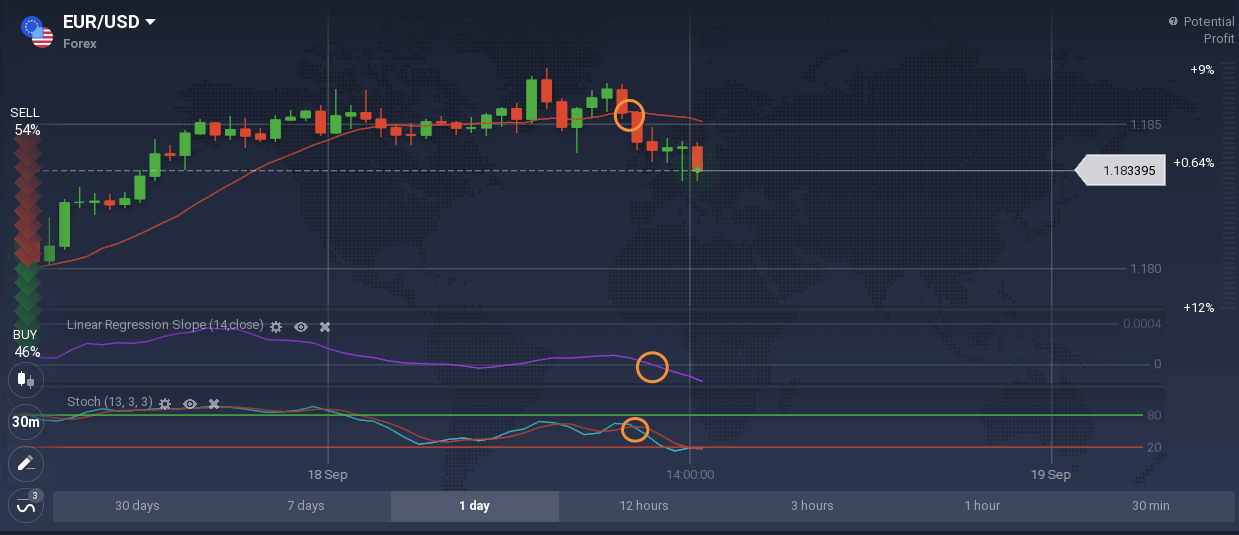
Though the example shows a larger timeframe (the candlesticks are set at 8 hours), this indicator may be efficiently used on shorter timeframes, too. As it is a lagging indicator, it is best combined with leading indicators like Moving Averages for a possibly more accurate chart analysis. Traders may also use such indicators as the Stochastic Oscillator to find entry points for deals.
These three indicators are used to confirm an ongoing downward trend on EUR/USD in the example below.
It is important to note, however, that past performance is not an indicator of future price development and there are never 100% guarantees of accuracy; therefore, a trader needs to stay alert and utilize risk management tools along with the strategy.
How to set it up?
To set up the indicator, simply find it in the Trend section in the indicators menu.
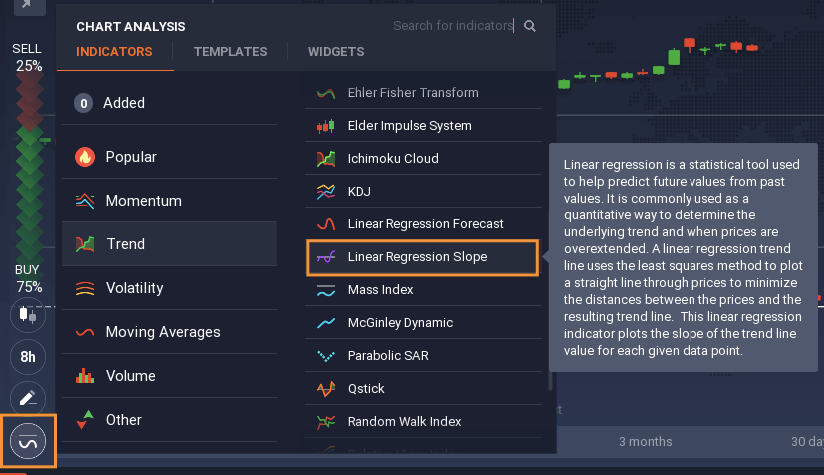
This tool has its default settings, but more advanced traders can change the period of the indicator: normally, the higher the period used for the indicator, the more significant the measurement is. It all depends on the strategy that a trader is pursuing.
