
It is possible for the quotes used when opening and closing deals to be confusing. There is bid and ask, then there is the average price. If you ever wondered why the deal was opened above or below the line that you see on the chart, this article is for you.
Bid and Ask
First of all, it is important to understand the concept of Ask and Bid prices. The Bid price is the price the buyer is paying. The Ask price is the price the seller is receiving. Ask and Bid quotes are the prices at which CFD-type deals are opened on the IQOption platform. The difference between Ask and Bid prices is called the Spread.
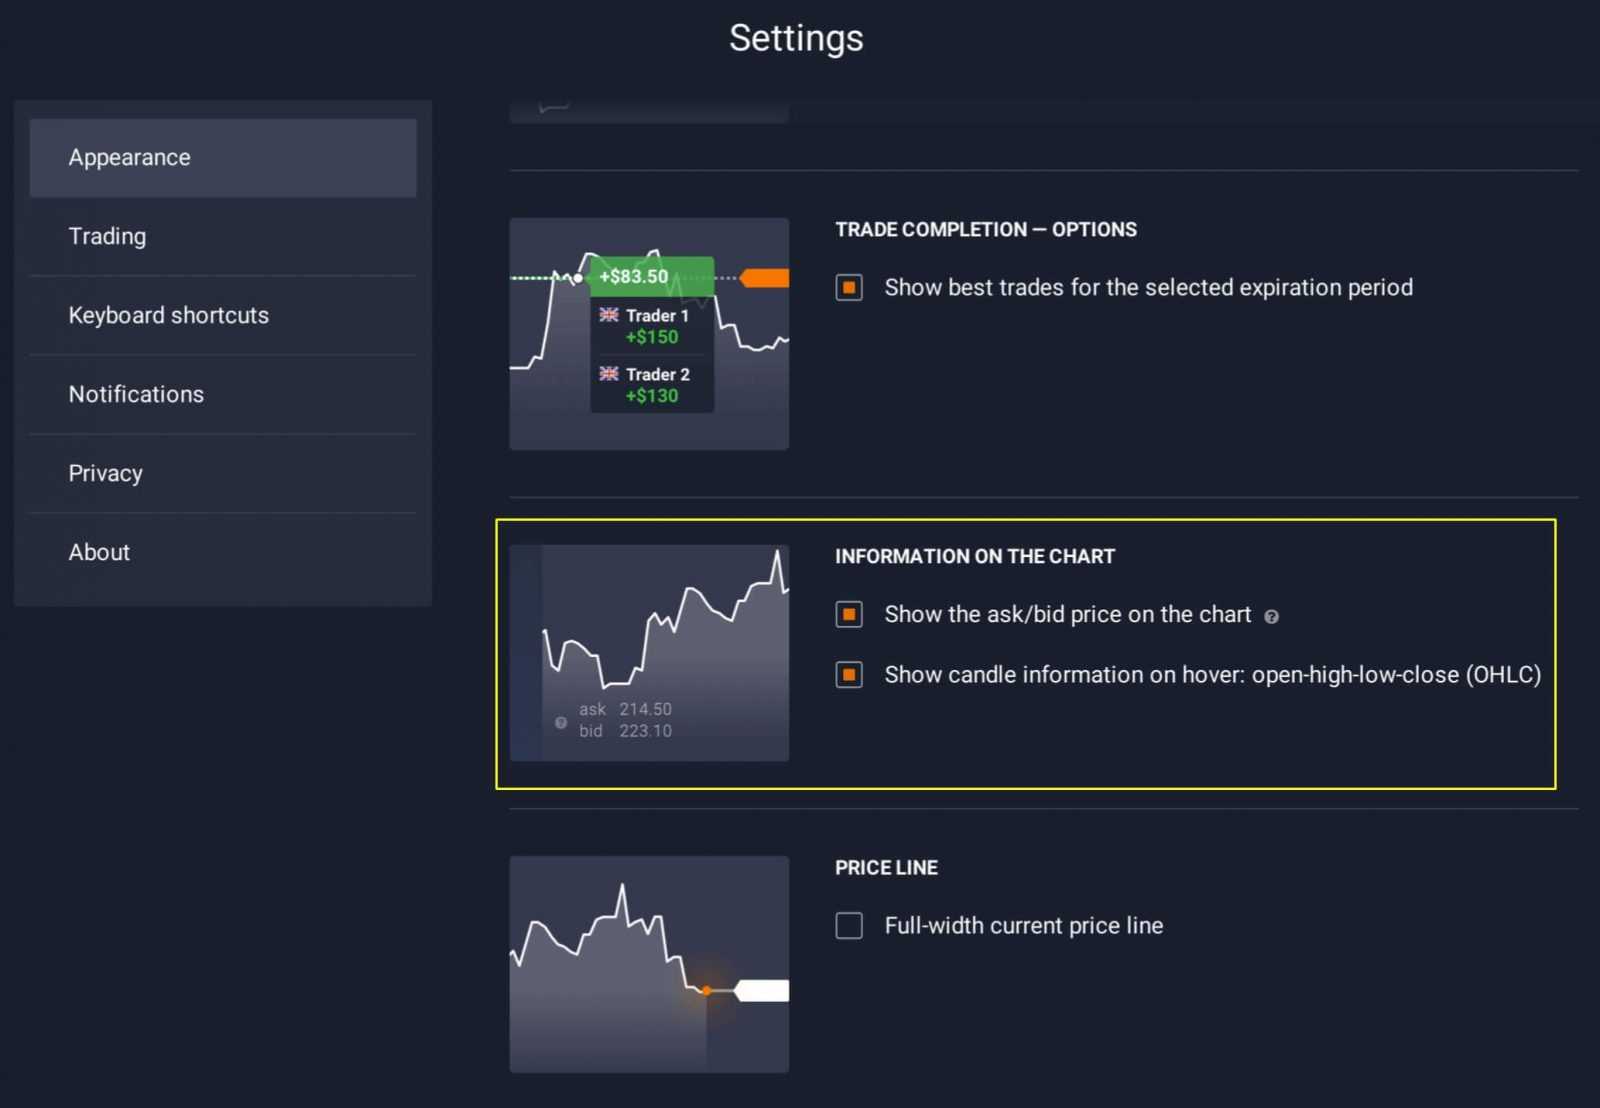
You may enable the visibility of Ask and Bid quotes in the settings menu and this is what it will look like.
So how does it work? Let’s look at an example.
Let’s say the trader opens a deal on GBP\NZD, under the Forex tab. The trader makes a prediction that the price will go up and open a <Long> position by clicking Buy>:
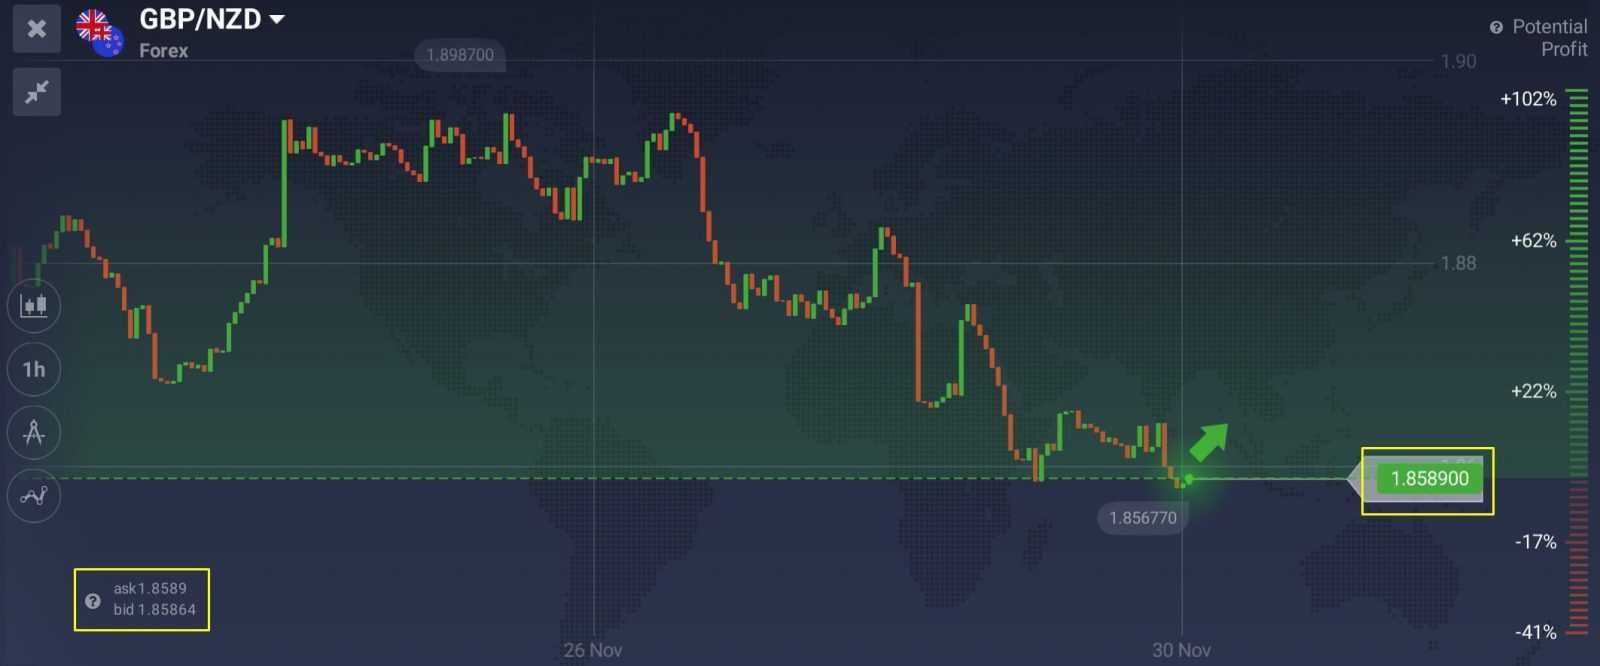
The deal is opened at the level of the current <Ask>, 1.8589. This means that the outcome depends on whether the Bid quote at the moment of the closure of the deal is higher than the Ask price at which the position was opened. Basically, the outcome depends on selling the asset (closing the deal) for a higher price than the one it was bought at.
That said, it is important to note that on IQOption traders do not actually own the asset, but rather trade the price development. In a case, for example, when a trader predicts a decrease of the price and opens a <Short> position by clicking <Sell>, the deal will open at <Bid> price and the outcome will depend on whether the closing price (current <Ask>) was lower than the Bid price at which the deal was opened.
Average price
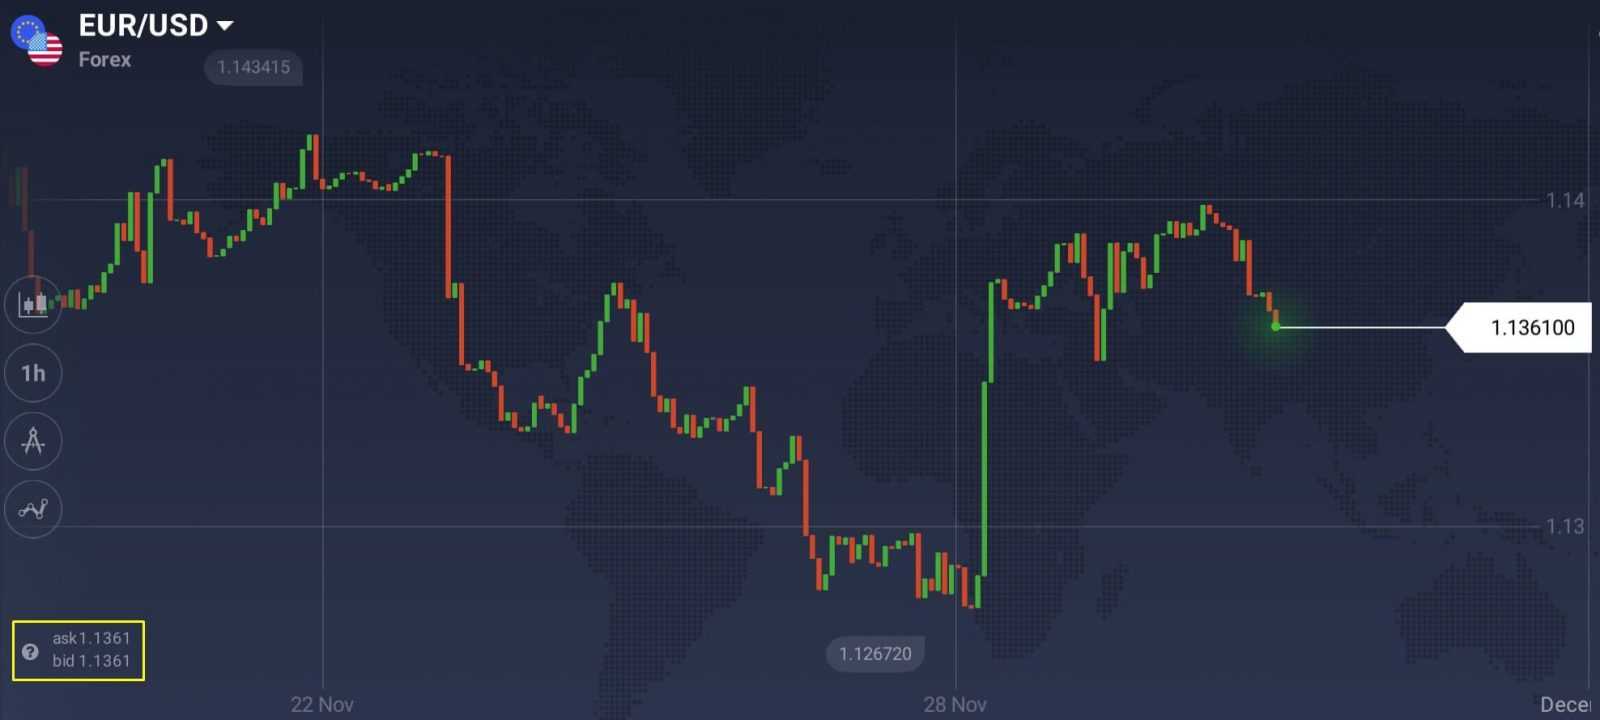
Some additional information that is visible on the chart is a white line showing a value, that is neither Ask nor Bid price; it reflects the average price. The average price is calculated according to the formula (Ask+Bid)/2 and it is shown on the chart for your convenience. That is also why on the platform you see 6 digits after the dot — it is a result of the division.
This basic knowledge is fundamental for a trader and crucial for making successful investments. Careful assessment of quotes will help you understand the chart better and plan your trading strategy accordingly.
