KDJ indicator is designed with the sole purpose of making your trading efforts as effective as possible and certainly deserves your attention. When traders use KDJ indicator correctly, it can help them determine both the trend direction and optimal entry points.
For those familiar with the basic technical analysis tools, KDJ indicator may seem similar to the Alligator and the Stochastic Oscillator. And just as the two above, it helps determine the trend direction/strength and optimal entry points.
It is worth mentioning that just as any other trend-following indicator, KDJ can and will provide some false signals during the flat market. For this exact reason, it is believed by many traders to be worth using on longer timeframes.
How to read KDJ indicator?
KDJ stands for K, D and J, which are 3 lines. The K and D are the same lines you will see when using the Stochastic Oscillator. The J-line, in turn, represents the divergence of the D value from the K. The convergence of these lines will hint at emerging trading opportunities.
Just as with the Stochastic Oscillator, oversold and overbought levels correspond to the times when the trend is likely to reverse. By default, these levels are set at 20% and 80%. When you use the KDJ indicator, you can adjust the settings for additional sensitivity / lower false alert count.
KDJ indicator settings
You can set the KDJ indicator in four easy steps:
- Go to ‘Indicators’ (bottom left corner of the screen);
- Go to the ‘Trend’ tab;
- Choose KDJ from the list of available options;
- Click Apply without changing the settings.
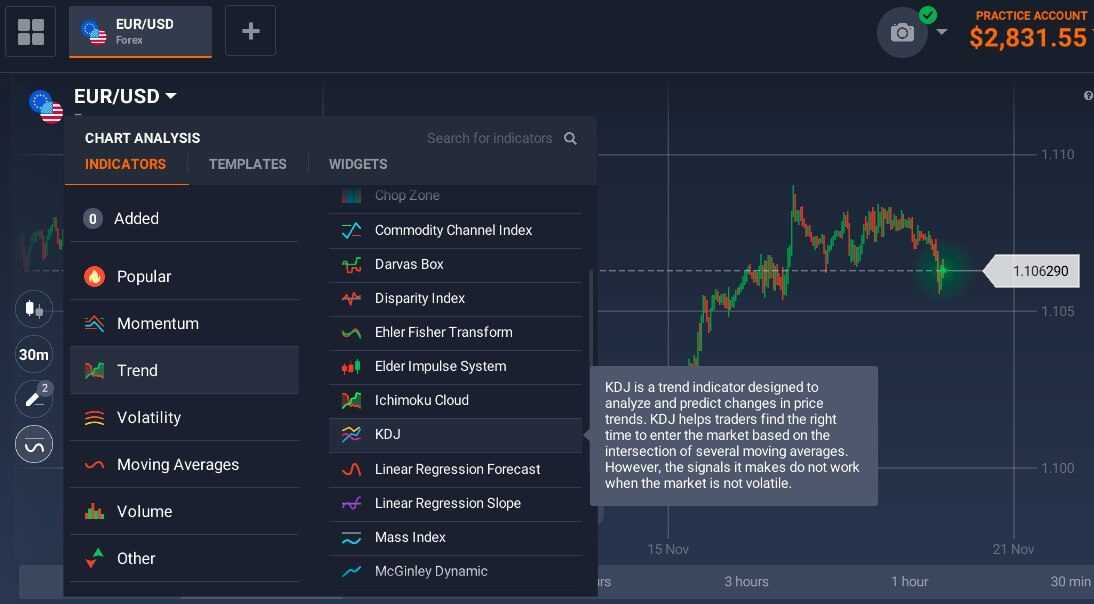
Your indicator is ready to use!
How to use KDJ indicator?
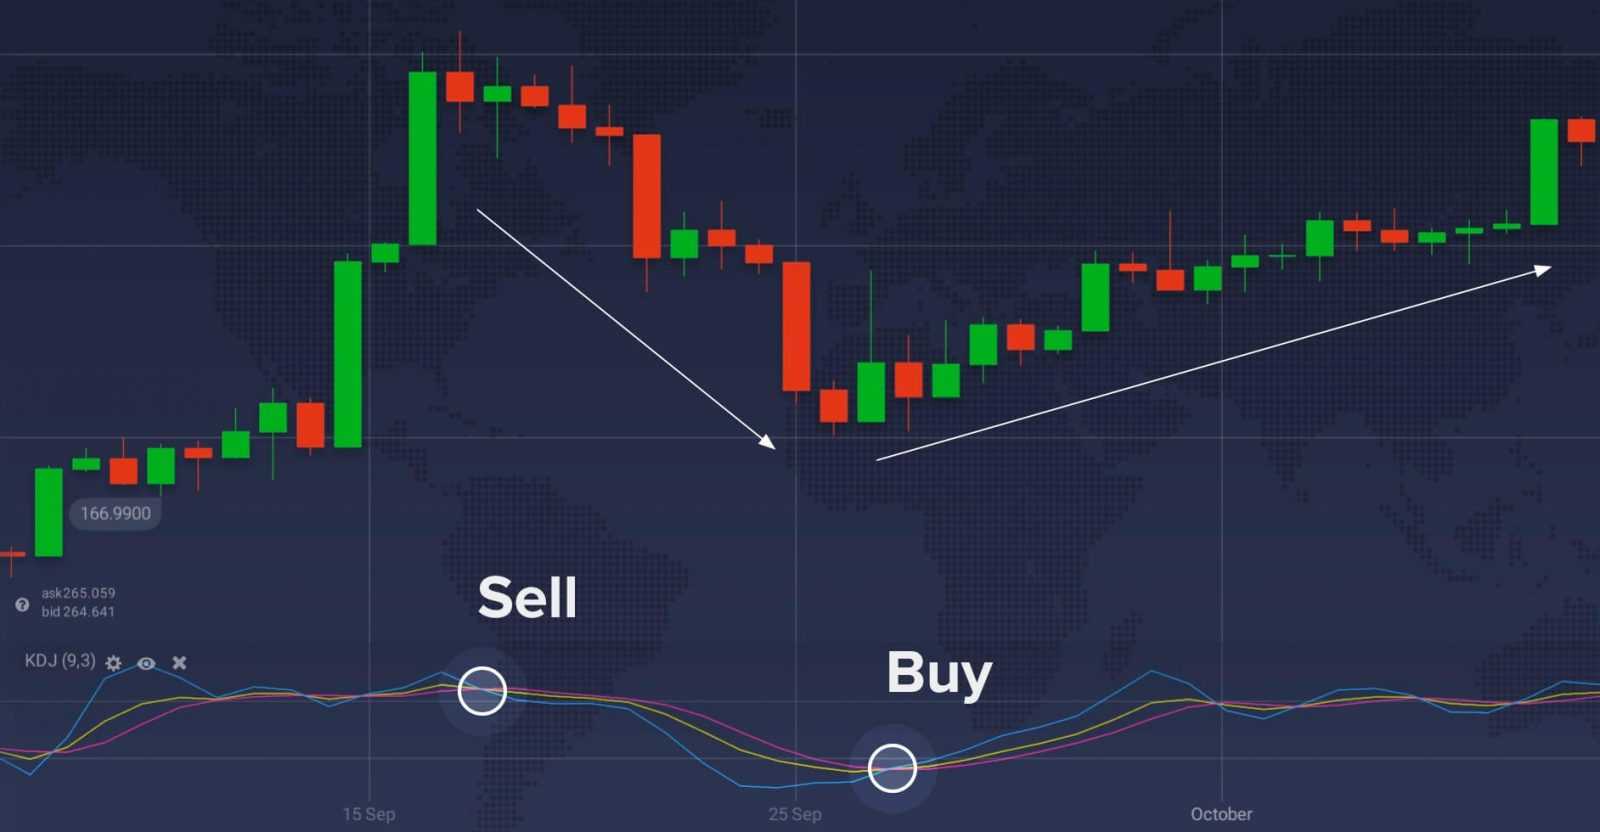
What kind of signals are you looking for? There are two types of signals you want to receive when trading with KDJ indicator.
☝️
Things to consider
For optimal results KDJ can be accompanied by other indicators, namely Average Directional Index (ADX) and Average True Range (ATR). The former is always ahead of the curve and can hint into an upcoming trend reversal. The latter is capable of determining the volatility of the market, which is especially useful since KDJ doesn’t work on the flat market.
Remember that no indicator is capable of providing accurate signals 100% of the time. From time to time even the best will fail, leaving you with a losing deal. No matter what kind of an indicator you rely on, don’t forget to follow basic risk management and capital allocation rules.
