One of the most important features IQ Option provides to traders is the ability to stick markers and symbols to an online diagram. To put it simply — the ability to use technical analysis. Web-based binary option platforms are rarely equipped with drawing tools and — even more rarely — with built-in indicators. The availability of technical analysis tools makes IQ Option extremely functional. Still and all, what’s the real benefit of such graphics and what’s the point of using the drawing board and indicators in the daily routine?
The Importance of Drawing
The drawing board is an essential technical analysis tool. Above all, this is due to the fact that many trading systems and a significant number of strategies are designed to think that traders rely on some elements of the diagram—for example, the support and resistance lines. Every trader chooses the lines and shapes he needs, as well as the timeframe for them, by himself. For this reason, it is extremely useful to plot markers on a diagram.
There are many ways to use such markers. Of course, the most common is to make them display trends. Trend is the most important thing in options trading, and it is of great importance to track trends. The use of the drawing board as a tool for creating graphical analysis markers and finding chart patterns— Diamond, Triangle, Three Peaks, Head & Shoulders, etc.— can be equally effective.

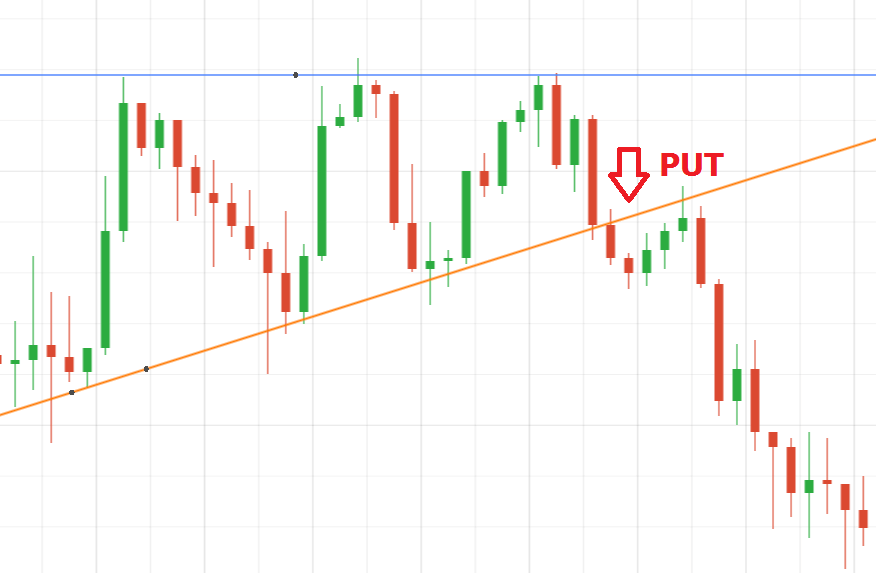
For example, the diagram shows that a Three Peaks pattern is generating, but to identify the entry point, i.e. the support line breakthrough point, is not an easy thing to do by sight. You can keep track of the correctness of the figure generating process and get a clear and understandable entry point only by using graphics.
The tools can be used not only to work with graphic strategies and simple patterns that are generated on the diagram. They can also be used together with indicators that are present on the platform.
Technical Analysis Indicators
It should be noted that the platform is equipped with four widely spread indicators — Bollinger bands, moving averages, RSI (Relative Strength Index), and Alligator. All of them can be used both individually and jointly. Indicators help traders forecast the direction of price movement correctly.
Bollinger Bands
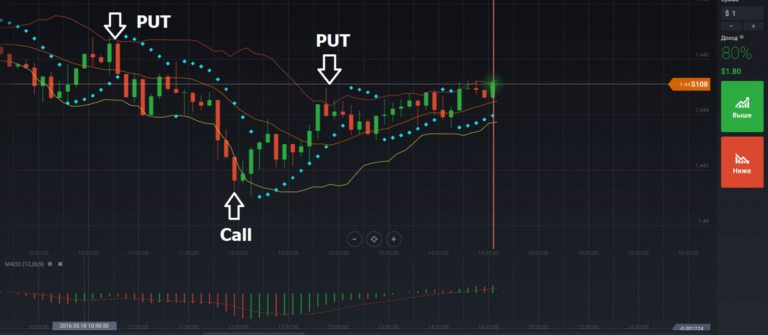
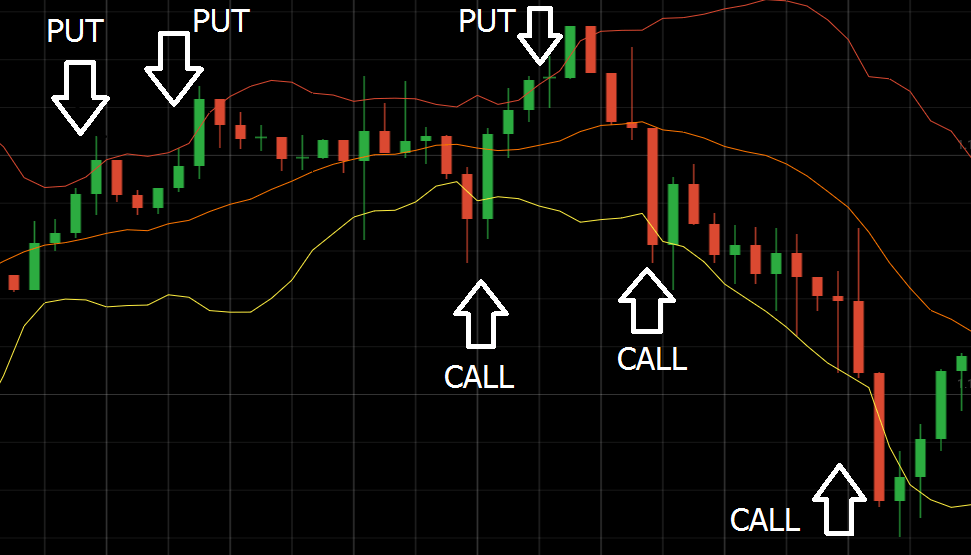
Bollinger bands is one of the most popular indicators. Based on data from the moving average and standard deviations, it creates a corridor within which the price moves. Focusing on the corridor borders, we get signals for the entry. If the price breaks the lower limit, we should buy CALL options, if it breaks the top limit—PUT options are the right choice.
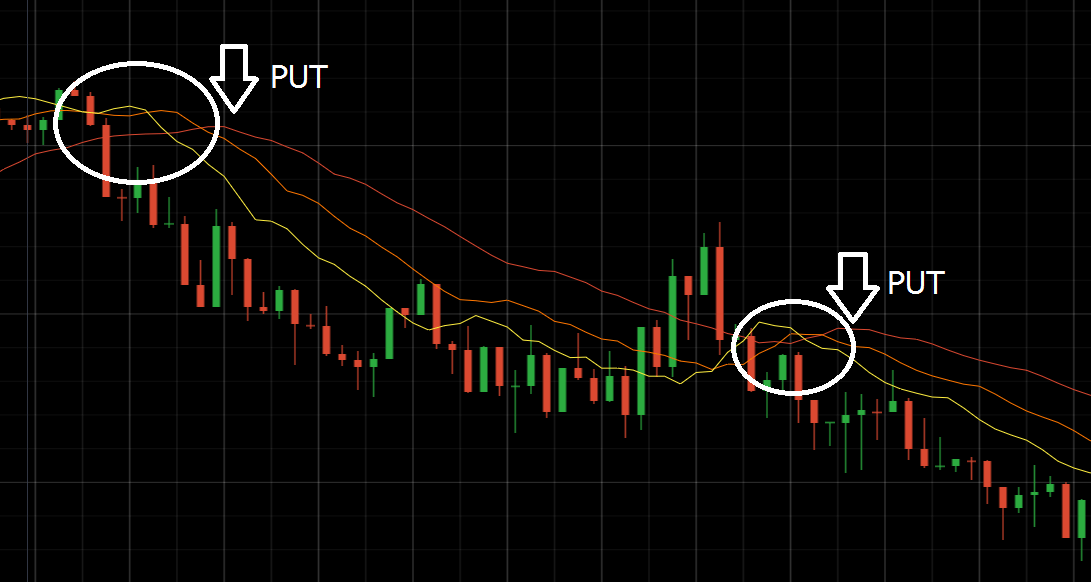
Moving Averages
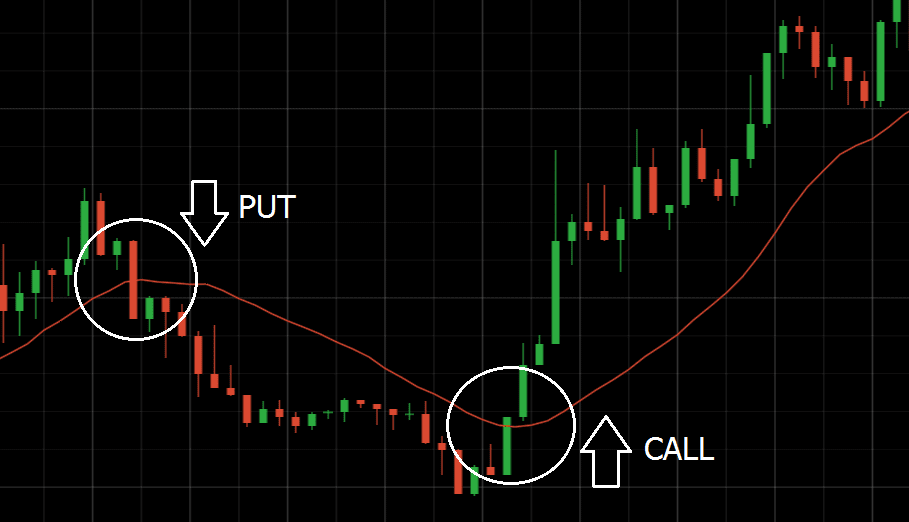
Moving averages show the average asset price based on a predetermined time interval—for example, 14 days. If the diagram crosses the moving average, it is a signal to buy options in the direction of the breakthrough. The longer the time interval is, the more accurate are the signals. However, their number will also decrease.

RSI
Relative Strength Index (also known as RSI) is only available when working with candlestick charts. This indicator is also very popular and is one of the most widely used globally. It reflects both the strength and the magnitude of price changes. Unlike other indicators, RSI is not displayed on the chart in any form but is built in a separate window just below the chart. A lot of different strategies are based on this indicator. RSI shows asset overbought or oversold levels based on historical data. If the asset is overbought, we should buy PUT options, if it is oversold—CALL options are more preferable.

Alligator
Alligator is highly competitive with the previous indicators in terms of popularity. It is presented as three moving averages of three different periods. When the lines cross, it means that the trend is about to begin. Once all three lines start pointing in one direction, the trend begins. After that, we should follow the trend. A number of profitable and simple strategies that have been successfully used by traders worldwide are based on Alligator.

Using technical analysis indicators helps not only get completely understandable analysis data, but also unsophisticated and clear entry and exit points. Moreover, thanks to Alligator the trader can fully track all opportunities, as the proper analysis of the price movement requires not only the information that an indicator itself can provide. Quite often, for example when using Bollinger Bands, traders use support and resistance lines to get a correct and clear signal to enter. They minimize the risks faced by traders. It should be noted that it is almost impossible to run such lines without a drawing board.
The use of both indicators and a variety of graphics on the IQ Option platform is not limited. You can put all necessary markers and indicators on the same diagram to make your technical analysis even more efficient.
Also you can read about Parabolic SAR, MACD and Stochastic.
The IQ Option UK can provide significant assistance to traders as it contains all the tools required for the proper technical analysis. It allows users to identify entry and exit points much more effectively, as well to analyze the diagram and to significantly reduce the risks. You can make more money by combining indicators and diagrams to filter the received signals with different tools. It is important to note that drawing tools can not only support us when working with certain indicator-based strategies, but also serve as a basis for profitable strategies. Also, they are extremely useful for hedging and working with patterns — all this makes the IQ Option drawing panel useful and important for traders. Trading with the use of indicators and graphics can ensure a regular income.
Trade now
excellent,i will try to learn these indicatirs
Pingback: AUDUSD. Main event of the week: a report on unemployment rate in Australia to be published on April 14, 04:30 GMT +3 | IQ Option Official Blog
Nice information. Its really helpful.
i need to use the bollinger bandswidth indicator on IQ option platform..can i get help on how to acquire it please…
Hello, Kibowa.
This aticle may be helpful for you: http://blog.iqoption.com/en/bollinger-bands/
We are goind to present video-edecution in this month. Education will helpl find out how to use Bollinger bands and other technical indicators on IQ Option.
How to get materials of iq option in pdf format. Each and everything about uses of tools
Dear friend, our materials cannot be found in a PDF format, but you’re welcome to get back to this blog anytime you need them 🙂
We wish you lovely trading experience with IQ Option and a great day!
Please I want to know how to start earning profit from IQ option..
Thanks for your interest! Success only comes with practice, effort, and time.
Please start with trading on the demo account. There you can check how strategies work for you without any risk of losing your real funds.
You might get interested in our educational section https://iqcc.io/en/tutorials and make more informed transactions. These not only explain the way the trade is made but they also describe the technical analysis tools and strategies based on them.
We wish you lovely trading experience with IQ Option and a great day!
Good information. Its really helpful. thang’s once again
i used this tricks but it is useful only on practice account but not for real account
.
in mobile app, Left column indicator Put/Call … how to read?
It will allow the selling option feature to be used with a swipe. We hope to make it available soon.
Thanks Aleksandra. I watched a tutorial regarding iq option on youtube. There shows that round watch indicated that buy, green signal and on the other hand it shows risk with red signal. How it is possible. Pls advise me. Thanks, Sarowar
Thank you for reaching out to us, Sarowar! We’d like to understand the question and help you. We kindly ask you to contact us at support@iqoption.com to look deeper into the matter. Thank you!
How to do you know if the trend is going up or you must call,put down on IQ Option
You conduct the technical and historical analysis and make a prediction, you will not know in advance any way, markets are too unpredictable.
u r so sexy
can you send me the pink freud
I am trying to prove my document/identity so I can open my account but it keep showing a message which says this platform is not supported! And I can’t get any further with it.
Hello, Matthew!
I kindly ask you to contact us here to get a certain help – https://iqoption.com/en/cabinet/messages/new
Trying to verify my account and I come up with this platform is not supported! Help
Hello, Matthew!
I kindly ask you to contact us here to get a certain help – https://iqoption.com/en/cabinet/messages/new
I want to deposit in my account please help what can I do to deposit real money
Hello, Machawe!
To make a deposit, you need to make a request in your personal cabinet. You can use Visa/Mastercard bank card or e-wallet, for example Skrill (www.skrill.com/en-us/) , Neteller (www.neteller.com/en) or Webmoney (https://www.wmtransfer.com/).. On the deposit page you can find all available payment methods https://iqoption.com/en/cabinet/counting .
The articles are helpful however they only choose or speak about a few indicators.
I normally use stockastick & CCI indicators and not even one of them was spoken of… give an advise on how they operate.
Please give more information on the two indicators mentioned above to cater for all IQ Option trading platform.
Thank you
Good afternoon, Lerato!
Would you be so kind to contact our Support Team here to get an assistance – https://iqoption.com/en/cabinet/messages/new
How do u deposit money in iqoptions
Good afternoon, Thabang!
Our traders can use Credit/Debit bank cards(Visa or Martercard) or use e-wallets like Skrill (www.skrill.com/en-us/), Webmoney (www.webmoney.ru/eng/) or Neteller (www.neteller.com/en) to create deposits/withdraw funds from their accounts.
I suggest you to use one of the above ways for your money transactions.
You may check all the available options on the deposit page:https://iqoption.com/en/cabinet/counting
Afternoon I’ve recently registered with IQ options and I have forgotten my password and I still haven’t received my password via email
Hello, Xolisiwe!
Please, check the spam folder as the recovery email might end up there.
If you haven’t received any, please, contact our support by hotline, email or live chat in your trade room (https://iqoption.com/en/contacts) and we will do our best to help you. Thank you!
Hi, im new to iqoption. how do i change from Area chart to candlestick chart on the mobile app? thank you in advance.
Hello, Uchenna!
Welcome to IQ Option! We will be happy to help you!
You may find the option to change area chart to the candle’s one in the icon “Chart Type” next to the “Indicators” icon on the lower left corner of your trade room on your mobile device (where you set the period for the chart- the very low panel).
If you have further questions, just let me know!
Thank you for helping me….i have found the candlestick chart….God bless you.
Hello, Uchenna!
It’s great! Thank you for your kind words.
We wish you a wonderful day! Take care!
Is there a way two RSI indicators (with 2 different periods) in an overlapped mode i.e one on top of the other
Hello, Eric!
If you set two or more RSI indicators at the same time they are going to be set one above the other. There is no such option as the overlapping RSI in such case.
But thank you for the interesting question! I will forward your point to our developers to see what we can do for such cases.
In case you have further questions, please, let us know!
hello
Hi!
How are you doing?
Do you have any questions about our platform?
Lost more than 800dollars i have lost and work with good stratgey anylising indicators but no profit i have seen give me any sugestion
Hello, Surya!
I am very sorry to hear about your losses!
The market is the living organism which changes quickly according to different situations. Your strategy might work under the certain conditions but as soon as the situation changes, you are not able to use the same approach to have good results.
In order to adapt to the changing conditions, it might be reasonable to follow the news and try to predict the price deviation direction for each particular time period.
For such purposes, many traders use the economic calendar. The economic calendar is a chronology of all major events in the financial world – news that helps us to understand how the market is moving at any given moment. Speeches from heads of state of Great Britain and Japan, reports on unemployment in the USA and Europe, inflation indices, GDP and oil resource forecasts–all of it influences the attitudes of market participants. That is why a sound economic calendar is a primary need for every trader.
Here you may read more about how to use the economic calendar on IQ Option platform: https://blog.iqoption.com/en/economic-calendar/
In case you have any further questions, just let us know!
Do you have any volume indicator in your platform?
Hello, Pheonixrana!
Yes, sure!
Check this screenshot, please http://prntscr.com/klp580
How can I get, that ? Cause I can’t found on my IQ Option application.
Thanks and regards,
Indra
You just need to click the buttons I’ve marked on the screenshot 🙂
Are you using a web version/ desktop/ mobile app for trading on our platform?
Hi,
Is it possible to export data from iq option to use in other analytical softwares like Amibroker or metatrader?
Hello Mehdi!
Could you please specify what data exactly would you like to export?
You can download your trading history from this page:
https://iqoption.com/en/trading
Thank you in advance!
IQ Option Team
I’m really New in this platform with IQ OPTION, And in trading life also. I really loved this platform but since the time I start just getting loss it might be more than £500 ( the amount of loss) but I hope I will be able to break this wall.
Hello, Rahman!
We are very sorry to hear about your losses! Many people make emotional choices instead of analysis and it may result in losses. We always underline the importance of education and that’s why we are constantly working on our educational section and blog.
Please, try your strategies on demo balance first.
You may try different trading instruments ( forex, crypto, CFD), different time-frames, etc
Don’t hesitate to contact our support department to get a certain help on trading https://iqoption.com/en/contacts
can one use an indicator in a demo trade?
Hi, Emma!
Of course! The demo account is created so you could try different strategies and indicators without any financial risk!
Wish you good luck!
any good books you would recommend on how one can become a successful trader i would like to be a day trader but i want to know how i can analyse the market? how can one use your indicators to predict market movement, do you have lessons on how to use your forex tools? thank you.
Hello!
I want to state 5 tips of the successful trader:
1. Only trade with money you can afford to lose.
2. Be patient.
3. Be disciplined.
4. Never risk too much capital on one trade.
5. Don’t second-guess yourself, but do learn from experience.
Note that I am not giving you an investment advice. The financial services provided by this website carry a high level of risk and can result in the loss of all your funds.