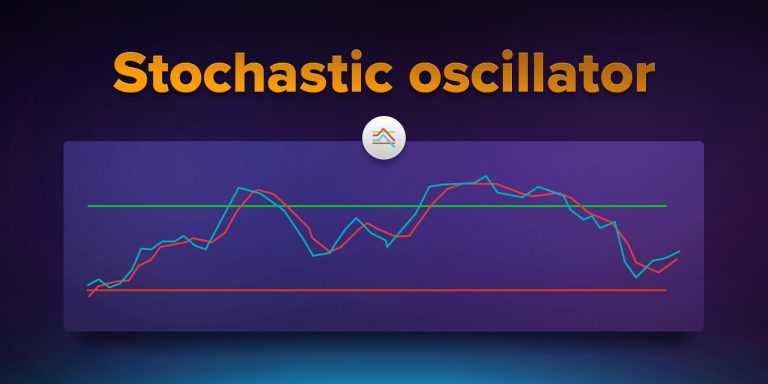
Stochastic can be an effective technical analysis tool but at the same time it is hard to master. Read the following article to learn more about the Stochastic and ways to improve your results.
Stochastic Techniques
The Stochastic Oscillator is one of the most popular tools used by traders. It is among the most versatile indicators in the technical analyst’s arsenal but comes with a warning. Don’t be fooled by it. The tool’s versatility is a two-edged sword, it will display bullish and bearish signals in either type of the market and can easily lead traders astray. The key to understanding what this great indicator is telling is understanding market conditions. Market conditions dictate price action and by extension the types of trading tactics traders want to use with the Stochastic indicator.
Crossovers
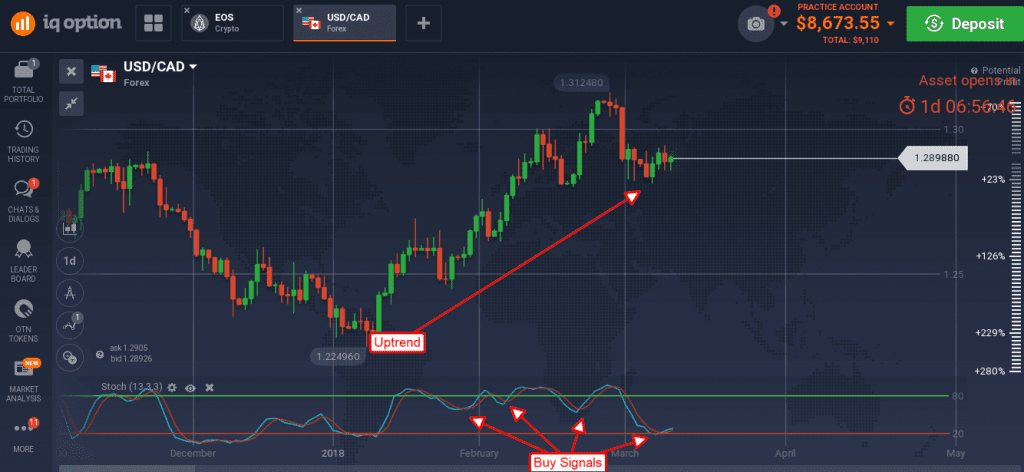
The most basic signal the Stochastic can provide is a crossover. This indicator can give several types of crossovers and all of them have different meanings. The most basic crossover is when the %K line, the shorter term of the two lines, crosses over the %D line, the signal line. This type of signal is very short-term in nature, relative to your chart time frame, and may result in a very brief move. For better results consider trend-following crossovers.
Another type of crossover is when the %D crosses above the upper or lower boundary line, usually set at the 20 and 80 levels within the oscillator’s range. A cross above one is bullish and a cross below is bearish, but of course, relative to which line it is crossing and the underlying trend driving stocks. Again, for higher accuracy results, only trend-following crossovers should be considered.

Convergences
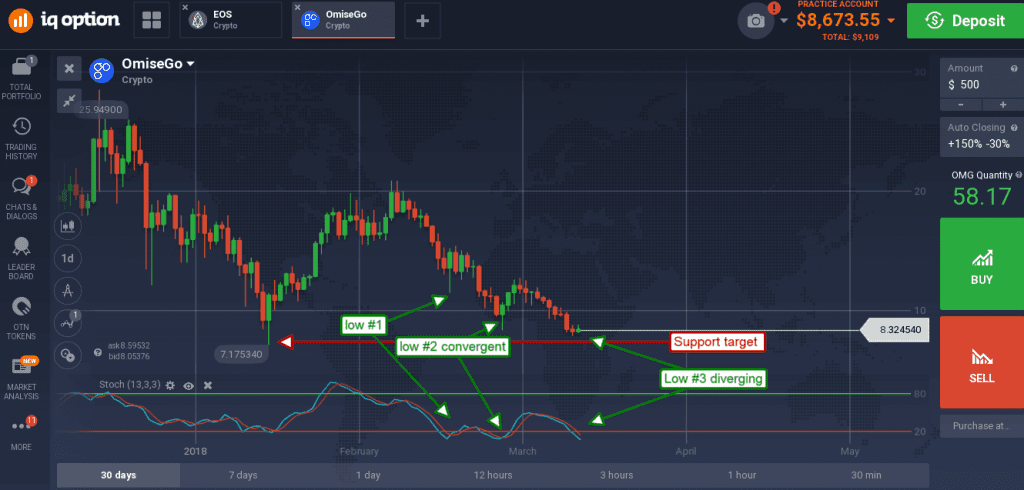
Where crossovers indicate where the market is going now convergences are the means of identifying what the market has been doing over the past few days, weeks or months. As the %D line tracks along with an assets price it will make peaks and troughs in tandem with the underlying asset. If an asset is in rally mode and making new highs with each successive peak and the Stochastic peaks are also successively higher this is called convergence. Convergence is a sign of strength in a market and an indication of continuation.
For traders this means that asset prices should be expected to continue moving higher or, if there is another trough, that the assets prices will retest the previous high AT LEAST, if not continue moving higher. If a convergence forms with asset prices bumping up against a resistance target the trader can expect that resistance level to be broken and surpassed.

Divergences
Divergences are the exact opposite of a convergence. If an asset price makes a new high, or a new low, and the stochastic fails to make a new high, or a new low, it is in divergence. This is an especially hard signal to trade because it signals weakness in a market and the potential for reversal, but not the timing of it. Divergences may carry on for many minutes, hours, days or weeks relative to your time frame. The key to using them is support and resistance targets. Support and resistance targets are prime price levels to target for potential price reversal.
Trend/NoTrend
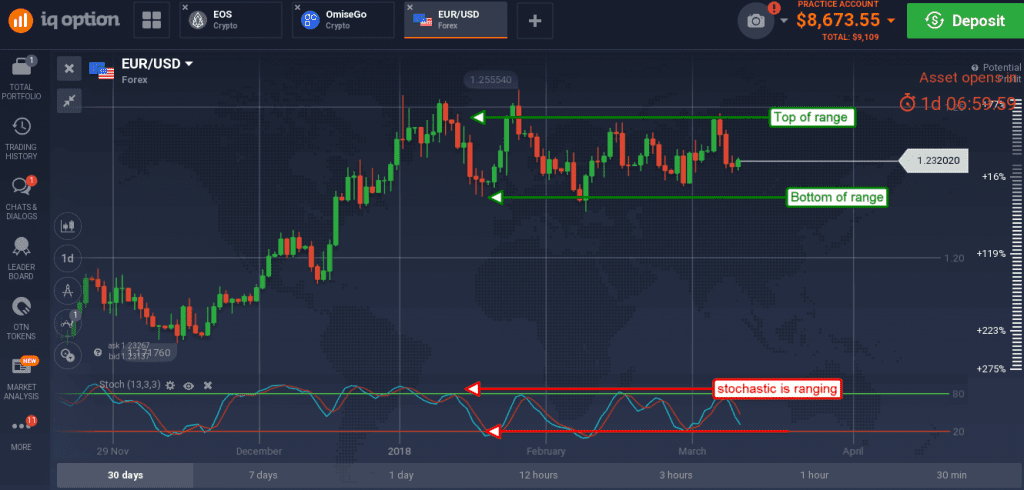
Stochastic is very useful in trend following situation but those signals may fail in a no-trend situation. But don’t worry, stochastic is good for that too. When asset prices are ranging the upper and lower signal lines switch from indications of strength to indications of reversal. In a trading range price action moves from one extreme to another.

If prices move up to the upper extreme they are said to be overbought and overbought markets are ripe for reversal. If prices move down to the lower extreme they are said to be oversold and oversold markets are also ripe for price reversal. If an asset is in a trading range and there is no expectation for a break-out (convergences), any time price reaches the overbought or oversold level fade the move and trade for a reversal.

