
The Mass Index indicator may look extremely simple and complicated at the same time. It is just one green line and some indicator values, but it could do a lot for a trader who knows how to use it. It works similarly to other oscillating indicators: it helps a trader find possible trend reversals for an asset. This indicator was developed by a trader named Donald Dorsey in the early 1990s. To this day, it remains a popular oscillator among many traders. Let’s see what it is all about.
How does it work?
The calculation of this indicator is actually fairly simple to understand. The indicator takes the range between the Highs and Lows of the price over a specific period of time (high minus low) and compares it with the previous ranges. When the range of the price widens beyond a certain point and contracts, the indicator suggests a possible reversal.
This indicator was originally created for stock trading specifically. However, it functions well with other assets and it can be implemented for short-term trading. The indicator has one specific most common signal called reversal bulge. Such a bulge can be seen when the indicator is set with the 25-day period. When the index reaches 27.0 and then falls below 26.5, it may be a signal for a possible reversal. Note, that the Mass Index does not show the trend direction, so it is best to use it with other indicators.
How to use it in trading?
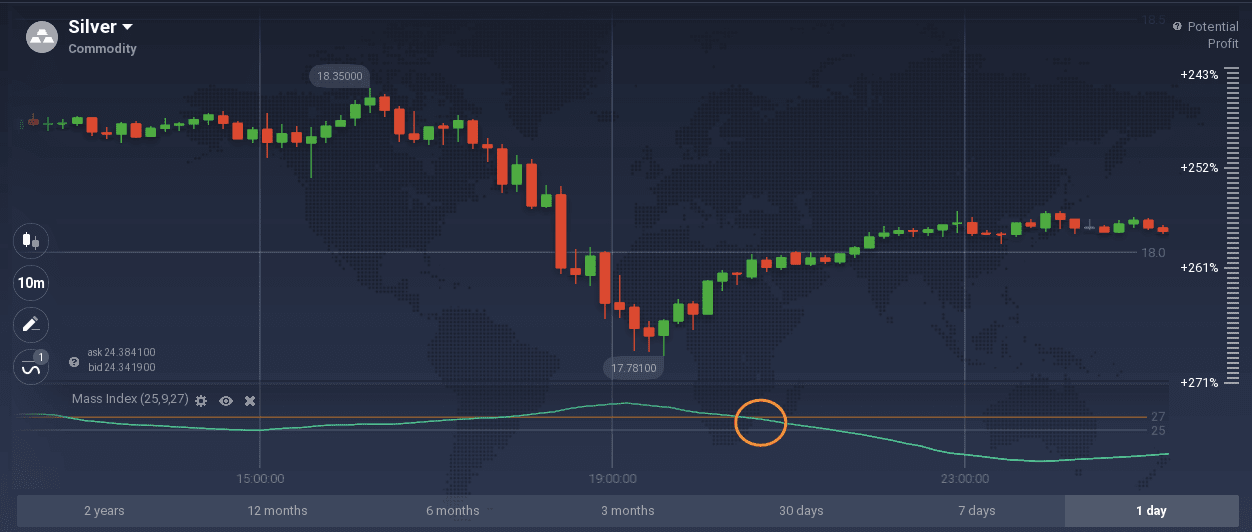
To illustrate the reversal bulge, the indicator is set with a 25 period. The Bulge Value is 27 by default, it is visible as an orange line in the example below. The indicator shows a signal for the reversal of the trend and, in fact, the Silver price starts rising after a downtrend.
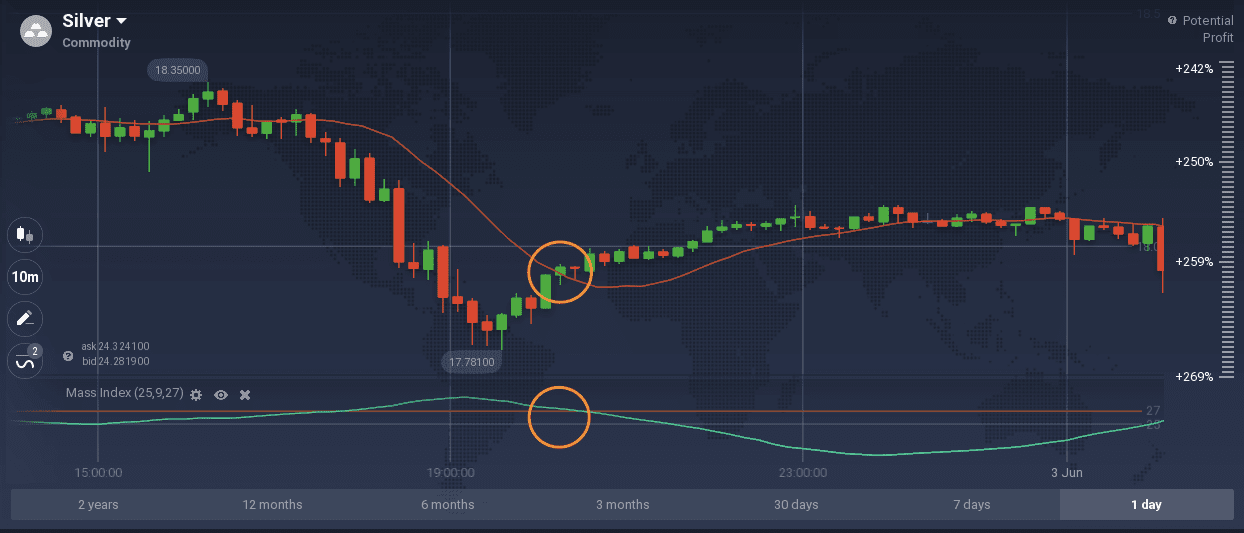
As was mentioned, the bulge does not indicate on direction, its only purpose is to determine price reversals. That is why traders might want to combine the Mass Index with trend indicators like Moving Averages, for instance. In the example below a trader is receiving a signal of a price reversal from the Mass Index and the candles are crossing the Simple Moving Average from below, which could be a Buy signal.
How to set it up?
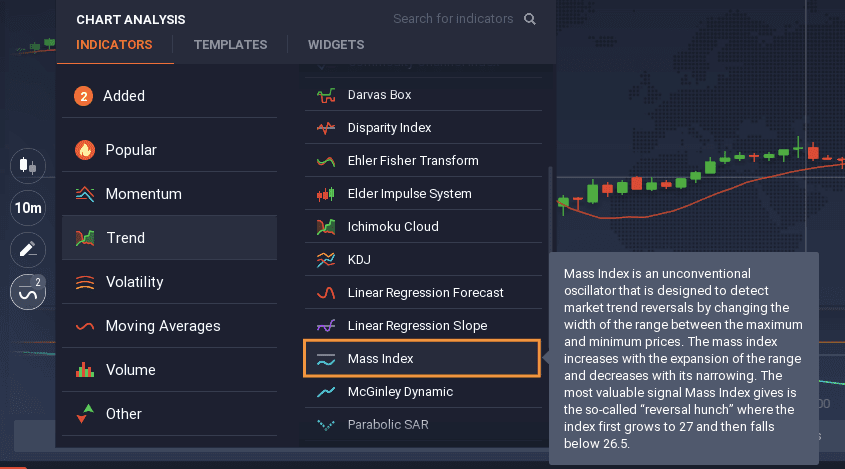
The Mass Index indicator is located in the Trend section of technical indicators on the platform. There is a brief explanation of the way it works, in case you need to refresh it in your memory when trading.
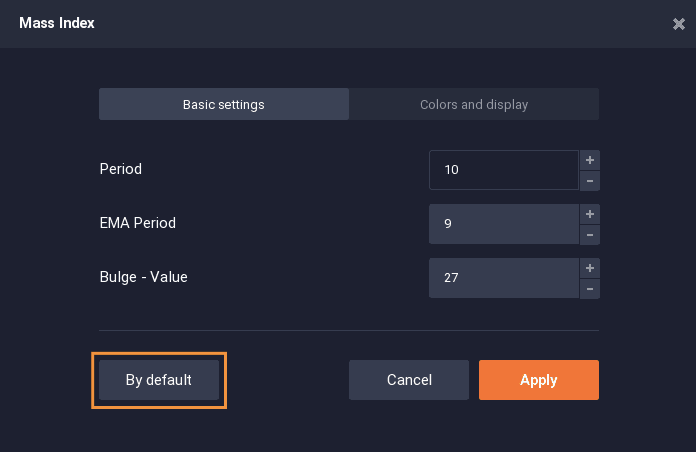
There are default settings for the indicator, which any trader may use. Traders that want to test the indicator may change the period to 25, as it is set in the example above, or to any other value that they consider useful for their strategy.
This indicator could be used as an alternative to other oscillators. It is normally used on short timeframes and it could be of use for intraday traders. One important rule to remember is that no indicator guarantees success, that is why traders have to implement a risk management strategy every time, regardless of their experience.
The Mass Index Indicator could be a helpful tool, but it requires practice and mastering it may take time. One may try it out on the Practice account to see if it could become a part of their trading approach.
