
McGinley Dynamic Indicator is a technical analysis tool that aims to solve the problem inherent in all moving averages — their reliance on fixed time periods. McGinley takes into account speed changes in the market (hence, its name). This indicator is not to be used on its own for the purposes of receiving trading signals, rather it should complement other indicators.
The logic behind
In order to understand why McGinley Dynamic is so special, let’s first take a look at how conventional moving averages operate. A 10-period simple moving average takes 10 last closing prices and divides them by 10. A 20-period SMA will do the same but with 20. Old and new results receive the exact same treatment. An EMA works in a similar fashion by allocates for weight to recent results, which makes it perfectly suited for short-term trading.
But how do you know when to use a 10-, 20- or 50-period moving average? McGinley Dynamic aims to solve this problem as it will automatically adjust itself to slow and fast markets. While moving averages tend to lag behind the actual price performance, displaying dated information most of the time, McGinley Dynamic will follow the prices more closely.
You can think of McGinley Dynamic as a better version of an SMA or EMA. McGinley himself (the man who came up with this indicator). Due to the way it is calculated, a 10-period McGinley will work in a similar fashion as a 20-period EMA does.
There is one more peculiarity that you might want to know when working with this analysis tool. McGinley moves faster in bearish markets (as their consequences are usually more devastating for retail traders) and slower in bullish markets (as to give the market a chance to develop necessary dynamic).
How to set up?
In order to use the indicator, do the following:
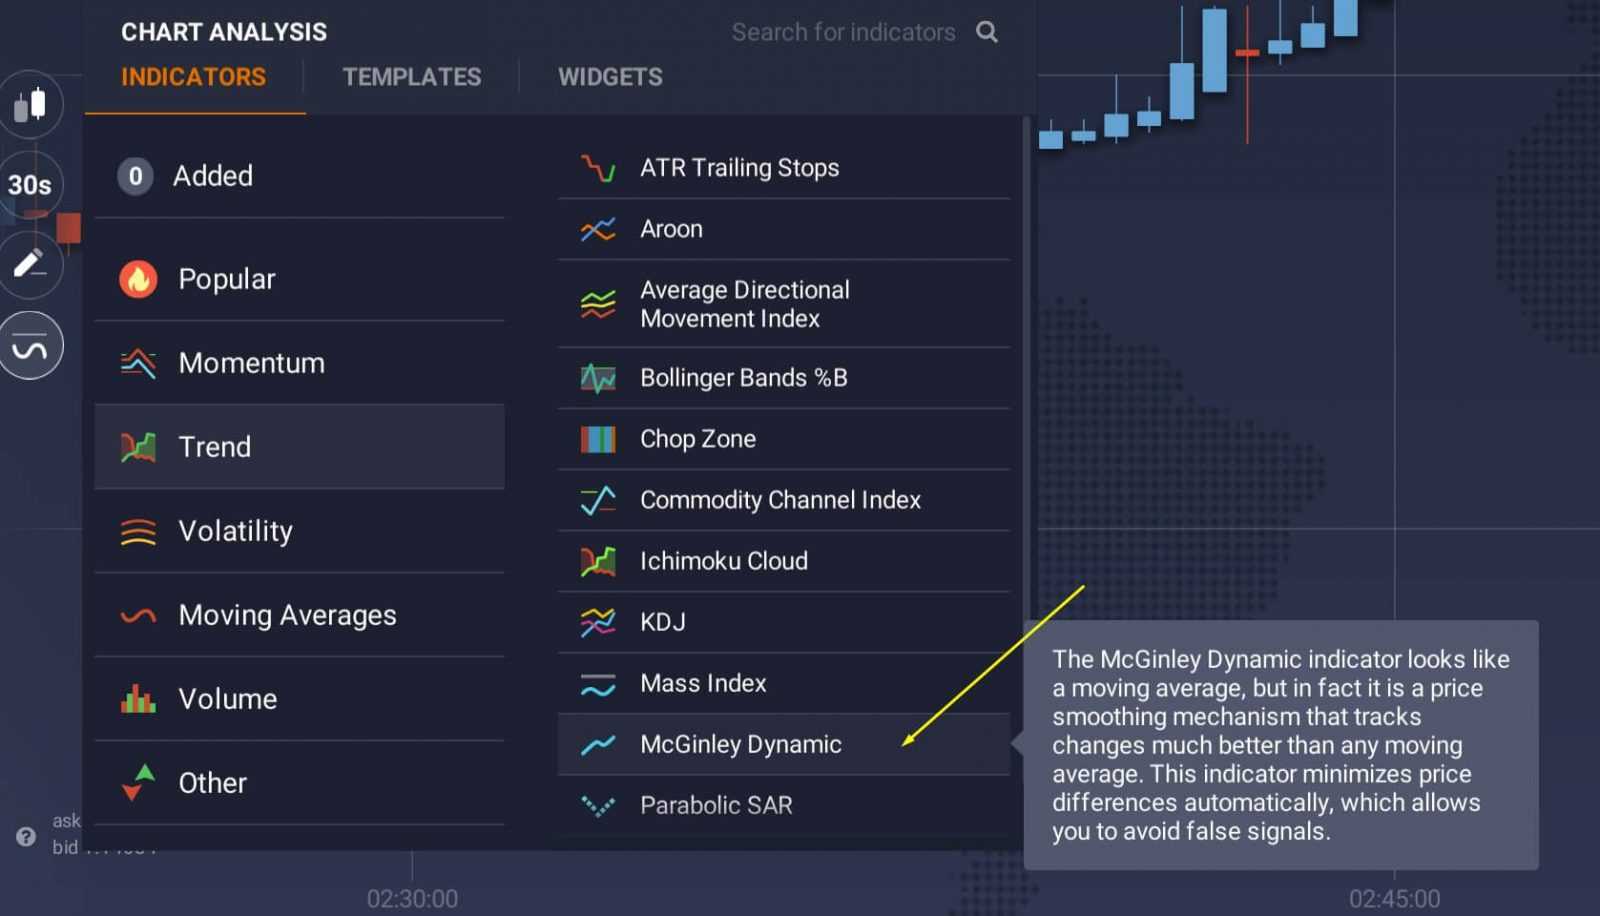
- Click on the “Indicators” button in the bottom left corner of the screen and go to the “Trend” tab.
- Choose the McGinley from the list of available indicators. Note you can also use the search bar in the upper right corner of the “Indicators” menu.
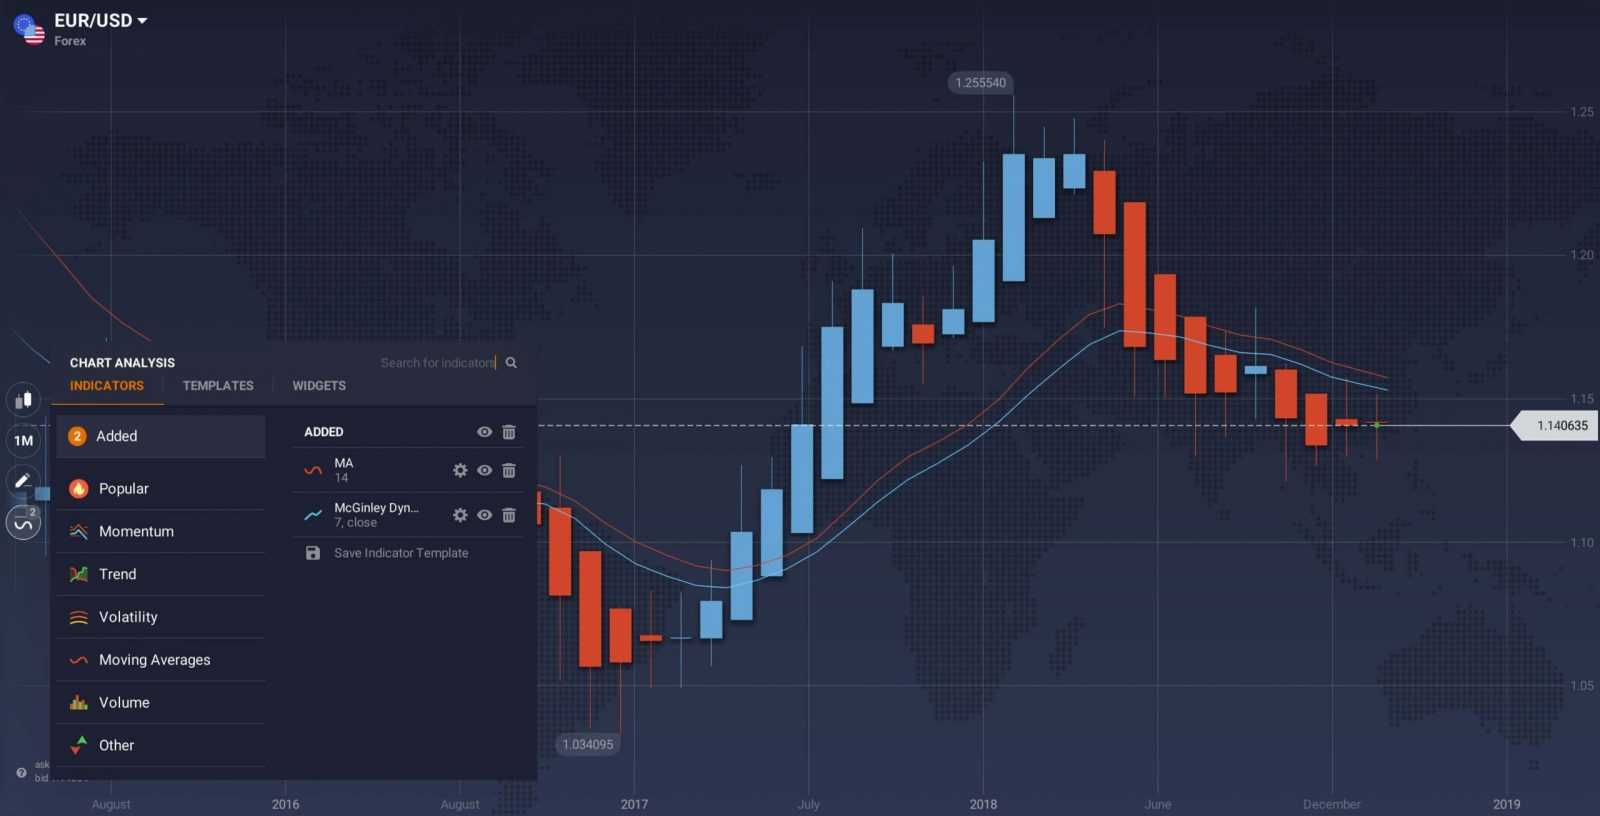
- Click “Apply” if you want to use the indicator with standard parameters. Or adjust the number of periods and the source of prices used for calculation purposes.
The indicator is ready to use!
How to use in trading?
What are you supposed to do with an indicator that doesn’t send BUY or SELL signals? Some traders will discard it, labelling it useless, and will be wrong. McGinley can help you get a better understanding of where the market is moving and, unlike an SMA and EMA, do so in a timely and accurate manner. It can also work as a complementary tool for oscillators, volatility and volume indicators. Although it is not supposed to be used on its own, McGinley can still hint at possible entry and trend reversal points as a part of a more complex trading system. Please note that, despite being a helpful tool, this indicator is not guaranteed to provide accurate results 100% of the time (just as any other indicator).