Linear Regression Forecast (LRF) is a technical analysis indicator that takes one of the key concepts of mathematical statistics — linear regression — and turns it into a precious analysis tool. Linear regression is used in statistics to approximate existing trends and predict future values. Unlike some other indicators that rely mostly on the expertise of their respective developers, Linear Regression Forecast relies on hard science! Learn how to set up and use Linear Regression Forecast in trading by reading this article.
How does it work?
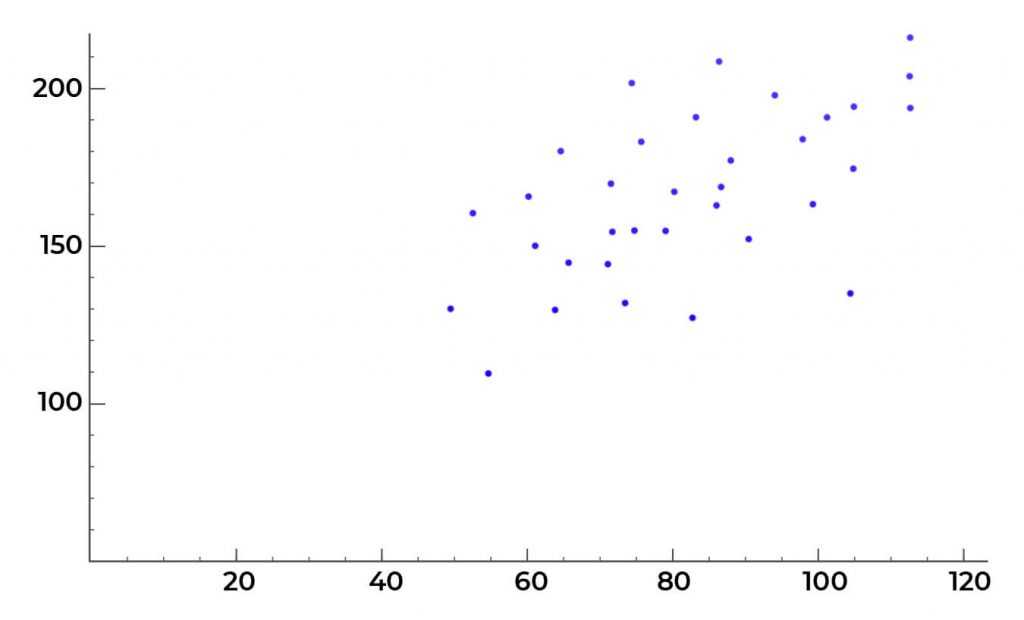
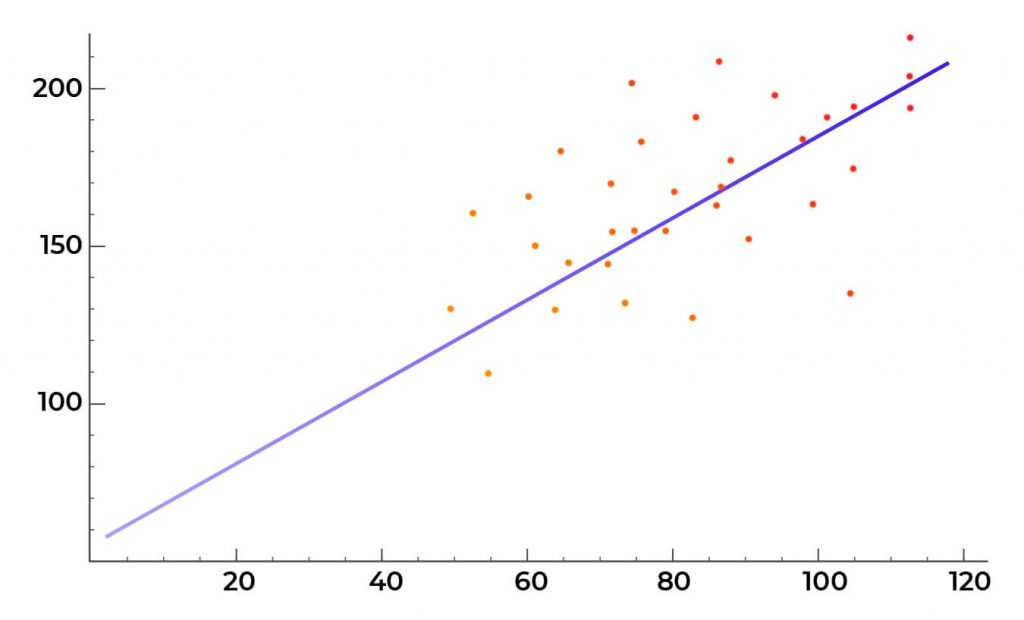
In order to understand how the indicator works, you will first have to grasp the concept of linear regression. Believe me, it is not that hard. Just for a minute forget that we are talking about trading here. Let’s instead imagine a group of people, everyone with his own weight and height. Let’s plot their parameters on a graph.

We can clearly see that there is a certain pattern here: higher people tend to be heavier. Now, back to trading. By plotting historical prices on the graph and building a linear regression model with Linear Regression Forecast (the indicator will do so automatically), traders can try to estimate future asset prices.

Of course, market movements are more erratic than relations between people’s weight and height, as there is no single factor that determines the future price of the asset. Hence, the limitations of this approach. Nonetheless, this indicator can be used to get a better understanding of where the market is currently heading, especially when combined with technical indicators of different types.
How to use it in trading?
Despite its seaming complexity, this indicator is quite similar to a well-known moving average. At least, in the way it works. LPF takes prices for n periods and, based on them, makes a prediction, showing where the price is supposed to be next.
Some experts believe that due to the method used in this indicator to approximate future prices it can be more responsive than a moving average. So, if your trading system incorporates one or several moving averages, consider opting for LPF instead. Of course, after making all the necessary adjustments.
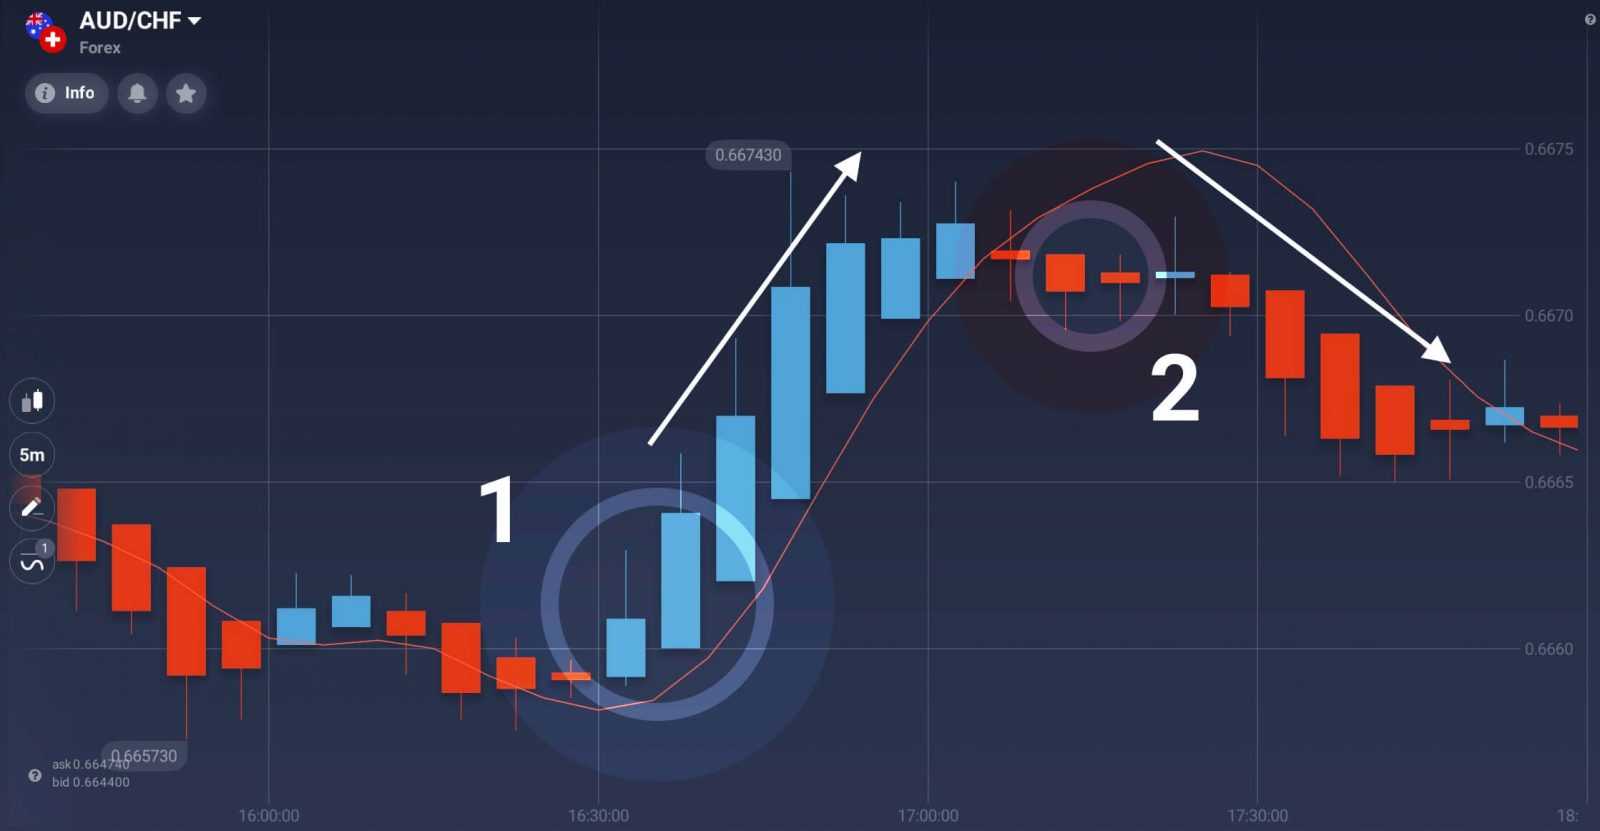
So, how does one actually use Linear Regression Forecast in trading? The indicator, of course, doesn’t tell you when to open or close the deal. All it does is provide you with a corresponding signal. When candles open and close above the LPF line, the market is trending up. When the opposite is true and candles open and close below the LPF line, the market is trending down. Traders can use information to go with the trend when a confirmation is received (point 1 on the picture above) or wait for a reversal (point 2 on the picture above). Two candles that close above/below the LPF line can be treated as a confirmation. It can be a good idea to double check signals received from LPF with a momentum indicator, as market momentum tends to wane just before a trend reversal.
It is worth knowing that this indicator works best on medium and long periods, as price noise can severely reduce its effectiveness.
NOTE: You might consider using this indicator along with other indicators and making it a part of a more complex trading system, where indicators of different types confirm each other’s signals.
How to set up?
Here is how to set up Linear Regression Forecast when trading on the IQ Option platform:
- Press the ‘Indicators’ button in the bottom left corner of the screen,
- Go to the ‘Trend’ tab,
- Choose Linear Regression Forecast from the list of available indicators,
- Click apply without changing the default settings.
Or simply use the search bar in the ‘Indicators’ menu.
Please note that no technical analysis tool or indicator is capable of providing accurate signals 100% of the time. Linear Regression Forecast may and will send you false signals from time to time. It is your duty, as a trader, to check them and separate genuine signals from the false one.
Now, when you know how to set up and use Linear Regression Forecast in trading, you can proceed to the trading platform to give it a try!


