Chande Forecast Oscillator (CFO) is an oscillator-type indicator that can help you estimate the future price of the asset. Ever wanted to know whether your favorite asset is going up or down? CFO can help!
This indicator could be useful for short-term CFD trading, as it only tells the expected direction of the price change. It is also easy to set up and use. Don’t miss an opportunity to learn more about it and try the indicator in action!
How it works?
Unlike most technical analysis tools that do not provide information on the future price of the asset, Chande was created with the sole purpose: to tell whether the asset price can be expected to go up or down. How is that possible that most indicators ‘do not provide information on the future asset price’, you may ask? Most indicators can indirectly point to the probability of a trend reversal or warn you of an upcoming retracement. However, almost none of them have been created with the purpose of directly predicting the future price of the asset. And this is where CFO shines!
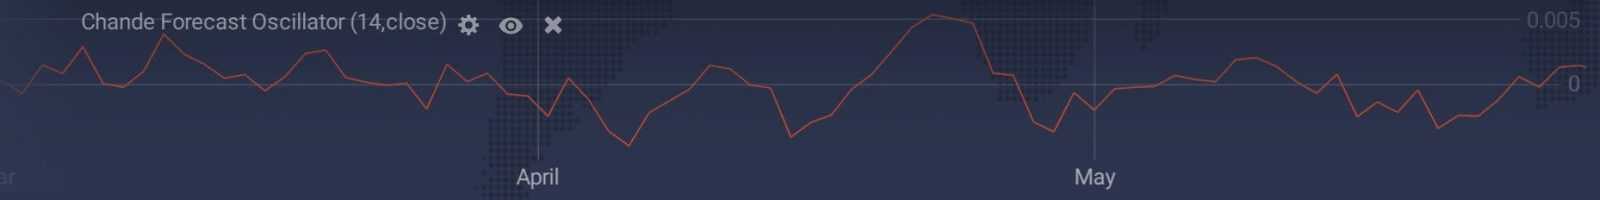
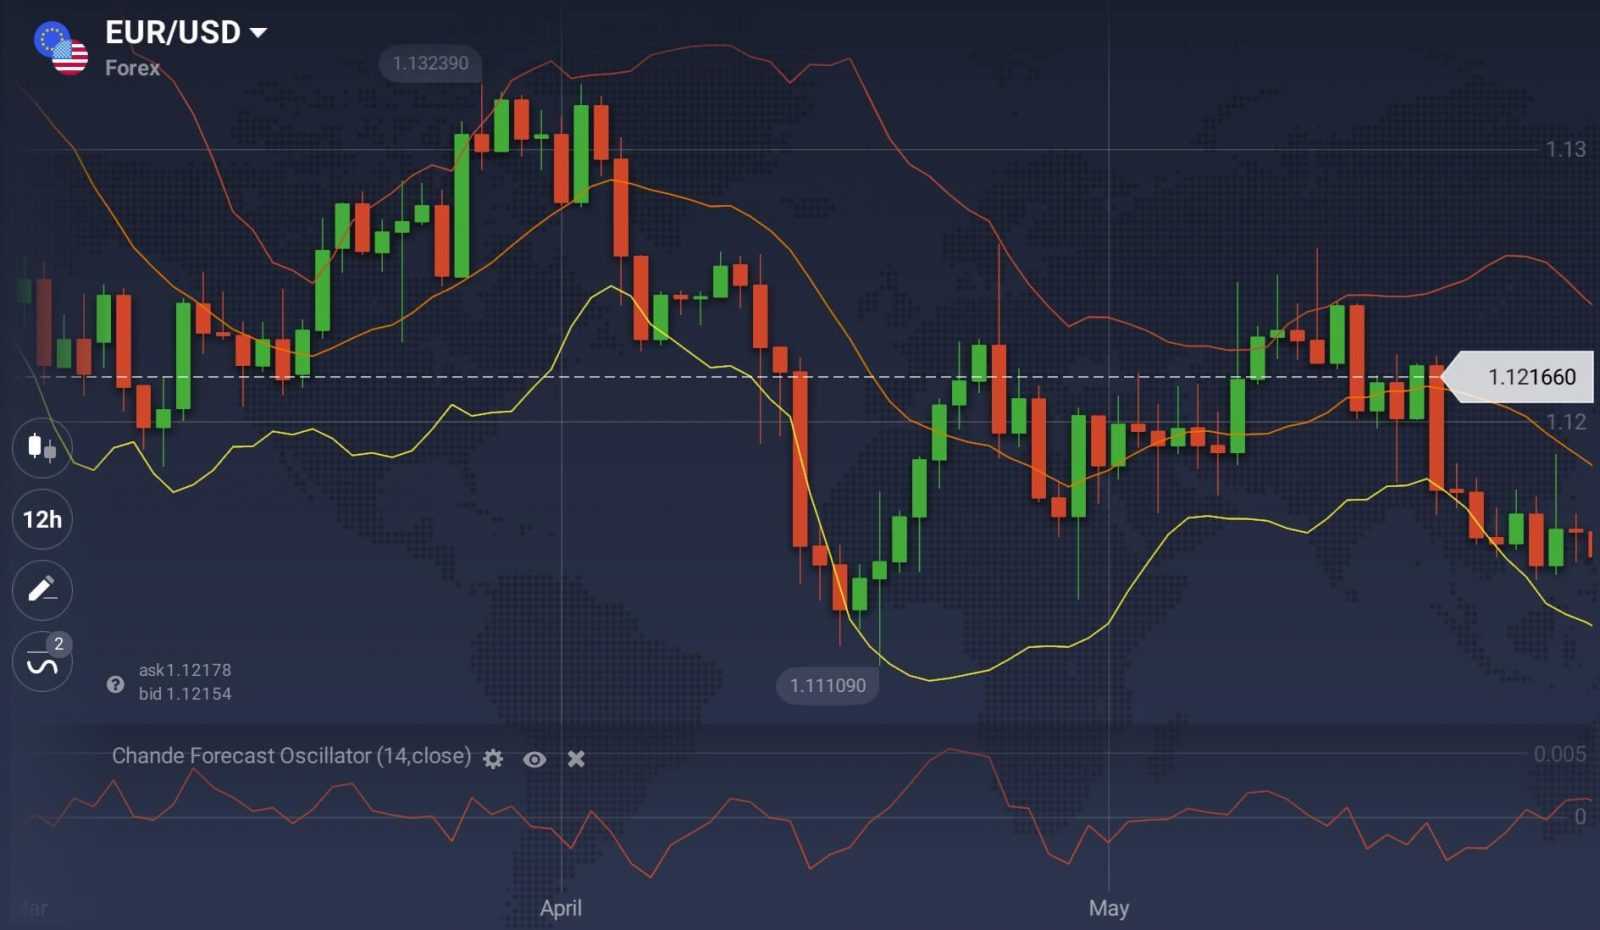
The indicator takes the difference between all recent gains and all recent losses and then divides it by the price of all price movement. Based on its calculations, the indicator will be either above or below the zero line. When the readings are above the zero line and moving up, the asset price can be expected to go up (according to the indicator). Conversely, when the readings are below the zero line and continue to go down, the asset price can be expected to go down (again, according to the indicator itself). Based on this simple assumption traders decide when to open the deal and in which direction.
How to use in trading?
There are several ways to apply this interesting indicator. Chande Forecast Oscillator can be used on its own or as a part of a more complex trading system (with the addition of 1–2 indicators). When trading exclusively with CFO, traders consider opening BUY and SELL positions depending on the indicators’ readings.
CFO can also confirm signals sent by other indicators. In this case, a bullish confirmation is received when the indicator crosses above the zero line. A bearish confirmation is received when the indicator drops below the zero line.
As always, there are two rules to follow when trading with Chande Forecast Oscillator:
1. All indicators can provide false results. CFO is not an exception. Do not expect its signals to be accurate 100% of the time.
2. Consider using other indicators to double check the information you receive from CFO. Trend-following, volume and volatility indicators can complement it just great.
The time frame you choose can greatly affect the signals that the indicator will send. Make sure that you are not opening long-term deals after receiving short-term signals, and vice versa. Experienced traders do not recommend taking the readings for granted. Rather, learn to recognize patterns that the indicator provides and use them in trading.
How to set up?
Setting up CFO is no different from the rest of technical analysis indicators on the IQ Option platform:
- Click on the ‘Indicators’ button in the bottom left-hand corner of the trade room,
- Go to the ‘Momentum’ tab and choose Chande Forecast Oscillator from the list of available indicators,
- Click the ‘Apply’ button without changing the settings.
Now, when you know how to set up and use Chande Forecast Oscillator in trading, you can proceed to the platform and give it a try. It can clearly become a valuable addition to your trading arsenal.
