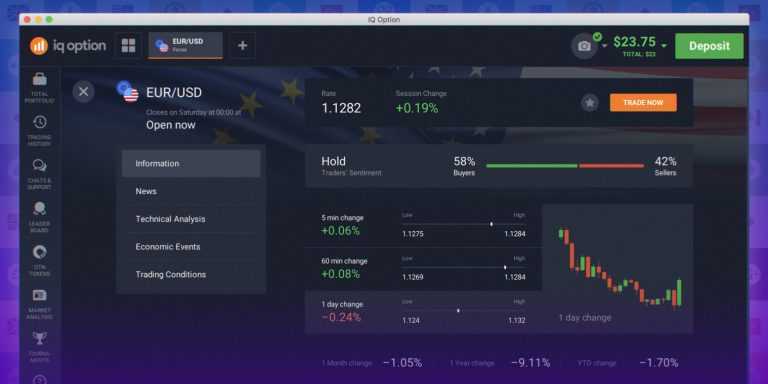
How many times did you strive to retrieve in-depth information on a given asset? How many external sources did you have to consult in order to dig deeper into the company/currency of your choice? Turns out, all this and even more can be done on the IQ Option platform. In order to access in-depth asset viewer, go to the traderoom, choose the asset you want to analyze and click ‘Info’.
Timely and accurate information is of great value to any trader. How can this feature help you improve your skills and become a better trader?

On the info page, you will find traders’ sentiment (sometimes referred as market sentiment). Put simply, this is what the market in general thinks about the behavior of the asset at hand. When more traders buy the asset, the sentiment is said to be bullish. When the opposite is true, and more people want to sell it, the sentiment is considered to be bearish. This is especially useful when trading with the trend. In this case, the trader will let the market guide him and open the deal in the same direction as the majority of market participants.

In the same menu, you can access the ‘Technical Analysis’ feature (arguably the most important and useful part of the in-depth asset viewer). It provides an aggregated sentiment for the chosen asset based on several technical analysis tools and indicators. As of now, the feature is available for the following currency pairs: EUR/USD, EUR/JPY, AUD/JPY, GBP/USD, AUD/USD, USD/CAD, GBP/JPY, EUR/AUD, EUR/CAD, NZD/USD, CAD/CHF, AUD/NZD, EUR/CHF. It will be added for more assets in the future. Note that this is not an investment advice but rather a summary of readings, provided by the indicators.

Here a breakdown of profitability for different time periods is available. How did the asset perform over the course of one week, one month or a year? This is something you can learn by looking at this one table. This feature can come in handy, especially when estimating long- and short-term profitability of the asset and deciding on what timeframe to trade it.

The list of all relevant events, scheduled for the day, is located below the profitability chart. Use it to pinpoint moments when prominent moves are most expected. Trading lacks certainty. Being able to forecast optimal entry and exit points can, therefore, be of great help to you. After all, it is important news and events that often move the entire market.
Here you can also check all recent asset-related news. For a currency pair or a commodity, major economic and political news would be of utmost important, as those are capable of influencing the exchange rates — and prices — in both directions. For stocks, corporate news and quarterly earnings reports will be the most important events to follow. All of the above can be found in this section.
Pro tip: note that you do not have to open the trading platform in a separate window and search for the asset you’ve been viewing (as you would have to when using external analysis tools). You can click either ‘buy’ or ‘sell’ directly from the viewer page. The trading platform will then open and you will be able to continue trading as usual.
Now, when you know how to use an in-depth asset viewer, you can give it a try on the IQ Option trading platform.


