When it comes to moving averages, there is plenty of choice. On the IQ Option platform moving averages come in all shapes and sizes: simple and exponential moving averages, rainbow and Arnaud Legoux moving averages. All are calculated differently and, therefore, provide slightly different results and should be applied differently. Least Square Moving Average is an indicator capable of predicting future behavior of the asset. Today we are taking a closer look at this indicator and discuss how and, most importantly, why to use it in trading.

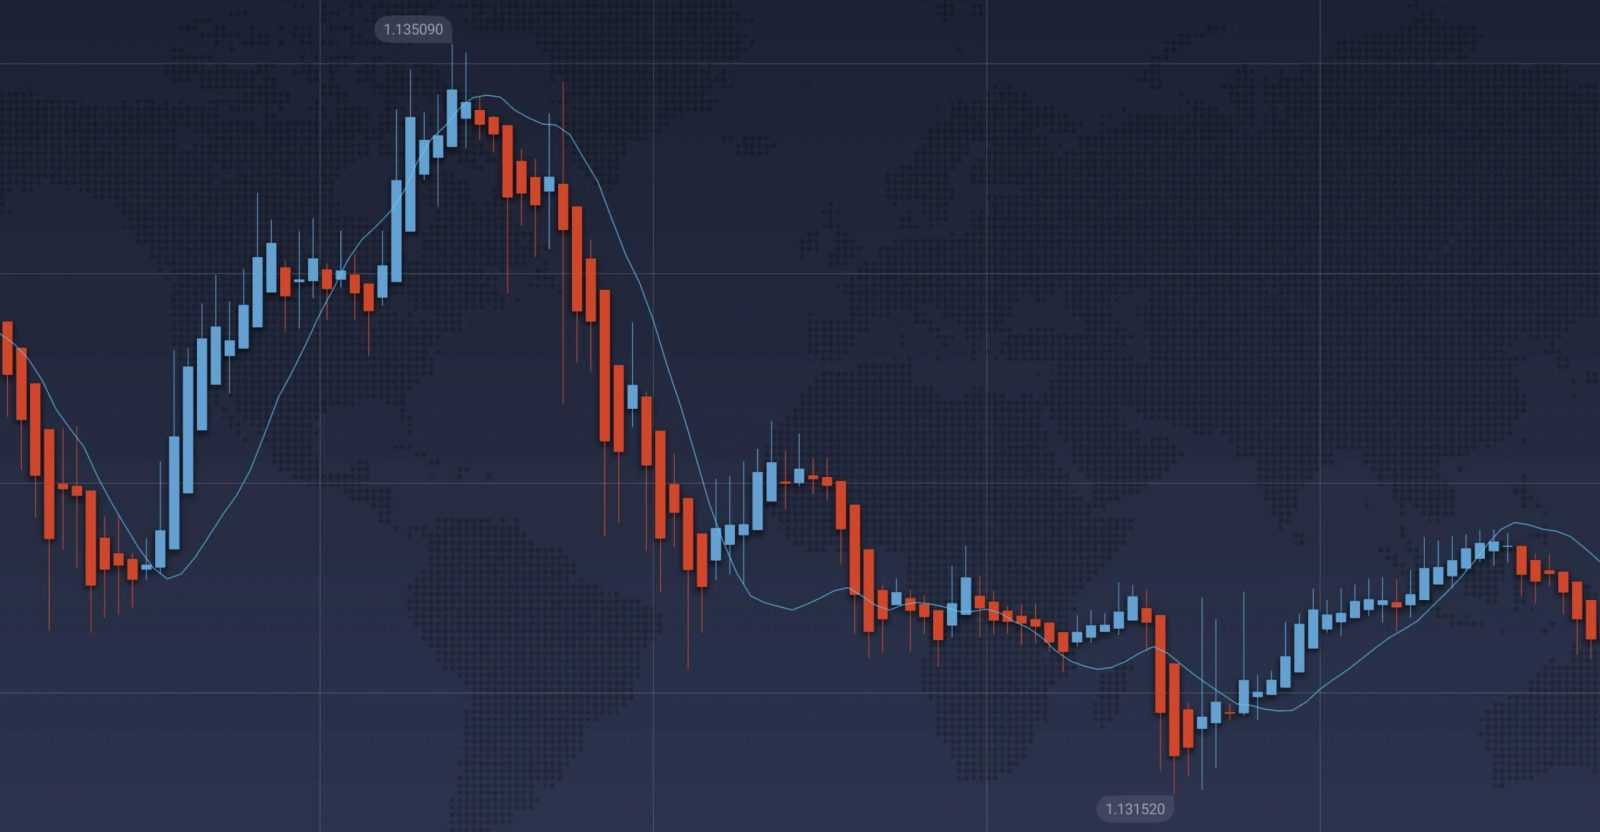
Least Square Moving Average (LSMA) relies on the use of the least squares method. The moving average will continue moving in the direction of the trend even after the trend has ceased. This indicator will, therefore, demonstrate what could possible happen should the trend continue.
LSMA is used as a crossover indicator, capable of identifying bullish and bearish trends. Trend reversal points play an important role in trading. By identifying them, traders can get an edge against the market and open their deals at the right moment. Despite being a simple indicator, Least Square Moving Average can nonetheless be of great help to those who know how to use it. And of course, it is worth remembering when working with LSMA that no technical analysis indicator is capable of providing accurate signals 100% of the time.
How to use in trading?
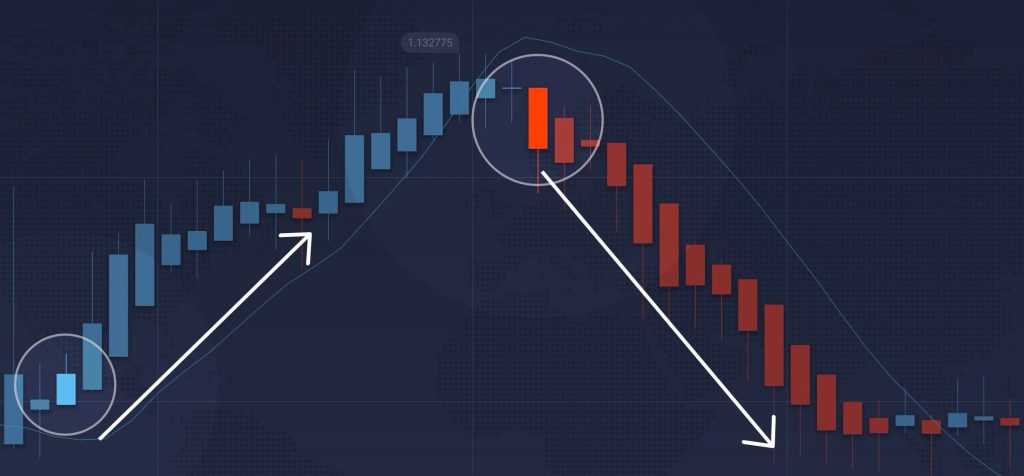
In order to use this indicator, you will have to follow both its readings and the price action. Since there is only one line, the signals this indicator is sending are quite straightforward. When the LSMA is moving up and the asset price remains above the moving average and is growing, traders consider opening a BUY position. When the LSMA is moving down and the asset price remains below the moving average and is collapsing, traders consider opening a SELL position. When using this technique, you will have to assess the behavior of the price chart in regard to the moving average, as both are moving quite differently.

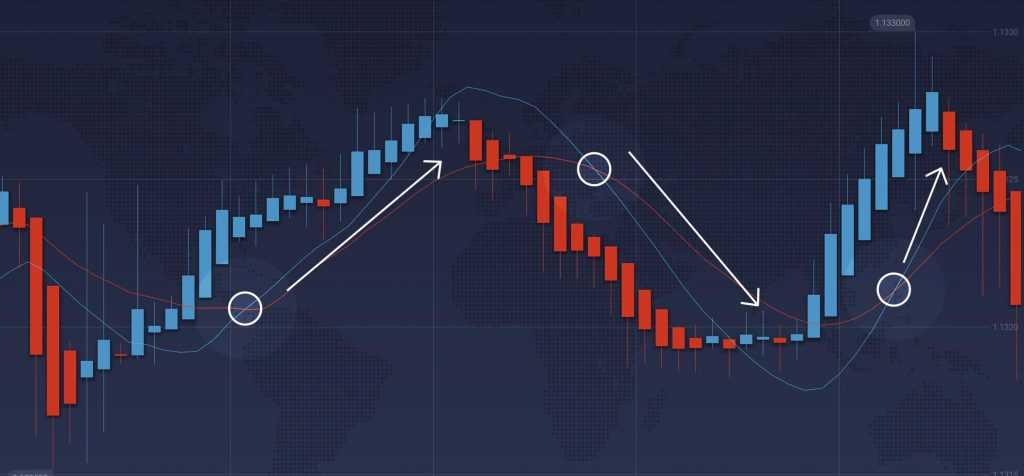
Least Square Moving Average can also be used in a combination with other moving averages (e. g. SMA, EMA) or a second LSMA with different period. In this case, the two indicators would work as complementary indicators, providing a confirmation for each other’s signals. The crossover between the two can be treated as a bullish/bearish signal depending on the trend direction.

Finally, LSMA can be used as a part of a more complex trading system when independent indicators of different types are expected to simultaneously provide the entry and exit signals. In this case, LSMA can work as a regular moving average.
How to set up?
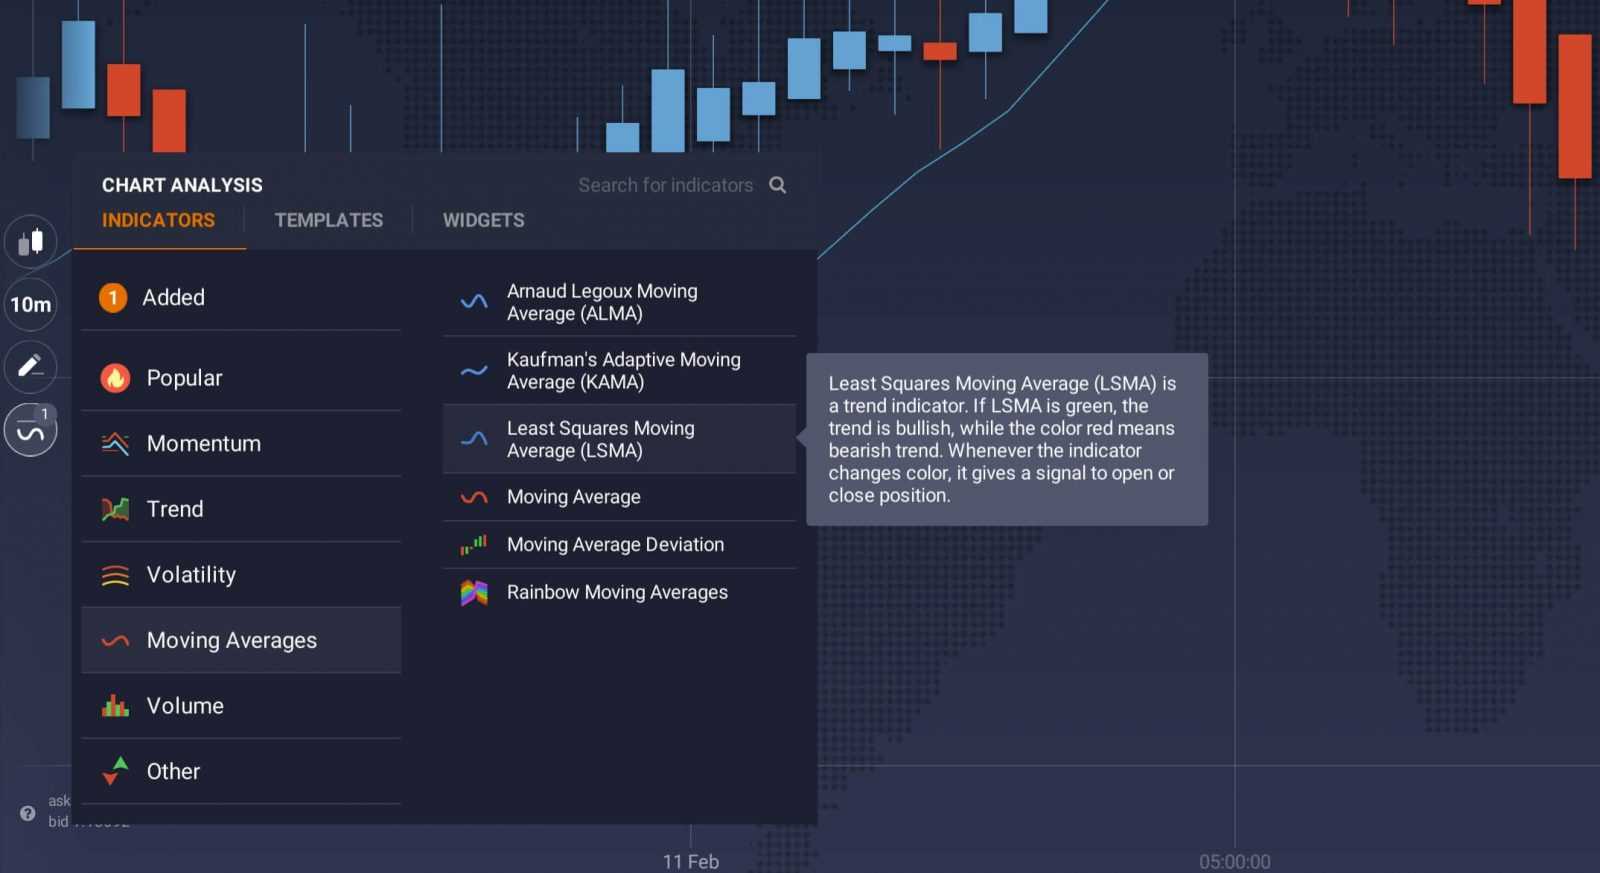
In order to use the indicator, click on the “Indicators” button in the bottom left corner of the screen and go to the “Moving Average” tab. Then choose Least Square Moving Average (LSMA) from the list of available indicators. Note that you can also use the search bar in the upper right corner of the “Indicators” menu.

Click “Apply” if you want to use the indicator with standard parameters. Or you can adjust the number of periods, the offset and the source of prices. The indicator is ready to use.
Now, when you know how to trade with LSMA, you can proceed to the trade room and try trading with it.

