With the enactment of BP 148 just days away critics are asking if the crypto currency will split, the real question they should be asking is just how high can it go? BP 148 is the latest upgrade to the Bitcoin algorithm and a chance for the chain to split; if a portion of miners refuse to accept the new changes the result will be an incompatible blend of old bitcoins and new bitcoins. While a minor concern, most experts agree the chances of this happening are remote, the real question traders should be asking is how high can Bitcoin price go? I mean, Bitcoins aren’t going to disappear and they are certainly going to keep attracting attention.

Is Demand There?
The ultimate limit on how the currency can go comes down to demand. If the demand is there, if the market keeps bidding up the price, the price will keep rising. In the current paradigm only a fraction of the total number of allowable Bitcoins have been mined. This will theoretically keep prices from rising as fast as they could since, in theory, there are going to be more coins in the future to satisfy demand. The reality is that that are only slightly less than 17 million Bitcoins in existence today, and over 7.5 billion people, so there really aren’t that many to go around which creates a sellers market. If you have a Bitcoin today there is still a good chance you will be able to sell it for a profit at some point in the future. Just look at the chart of past price action, anytime the currency has corrected it has bounced back with double digit returns, triple digits in some cases.
BP 148 is the latest upgrade to the Bitcoin algorithm and a chance for the chain to split; if a portion of miners refuse to accept the new changes the result will be an incompatible blend of old bitcoins and new bitcoins.
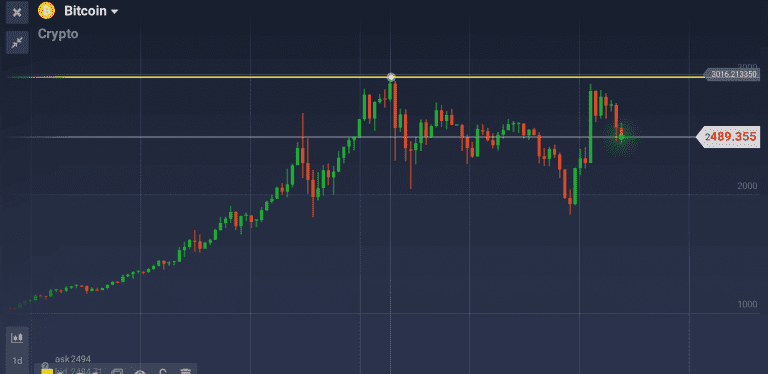
So, in terms of trading how high can Bitcoin price go? That will depend on the time frame you are trading. To keep things in perspective I will stick to the daily and weekly charts, those trading shorter time frames can use this analysis as a starting point. Looking to the daily charts to get an idea of near term targets we can see the index has just recovered from a deep correction. This correction shaved 40% of the price of the coins, the rebound has recovered much of that loss but not quite all. Based on the strength and trajectory of the rebound we can expect to see it retest the all time high at least, based on the technical signals within the rebound we can expect to see move much, much higher.
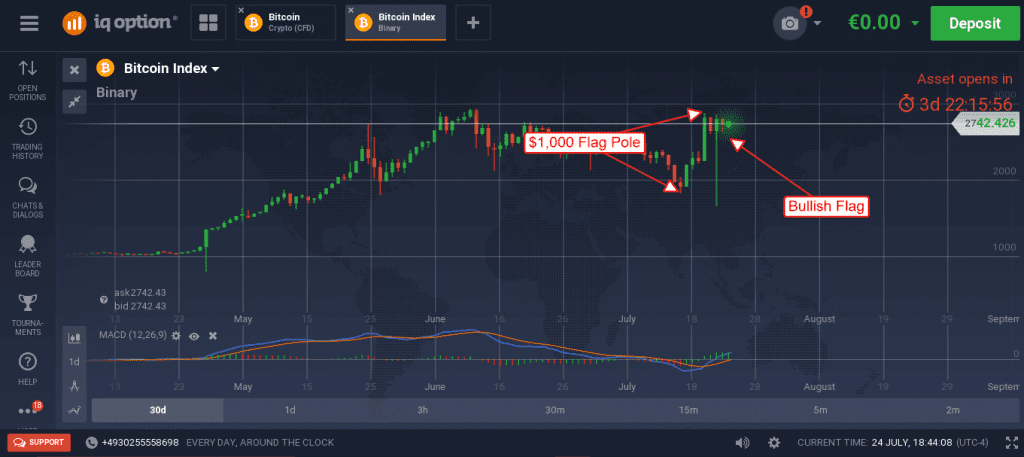
Over the last 10 trading days the BTC/USD pair has moved up by 55% and now in consolidation. This consolidation is a bull flag and continuation pattern. Upside target for this continuation pattern is the length of the flagpole or the amount of gain from the bottom to the formation of the flag. This amount is roughly $1,000 which puts upside target, on a break out, at $3,750.
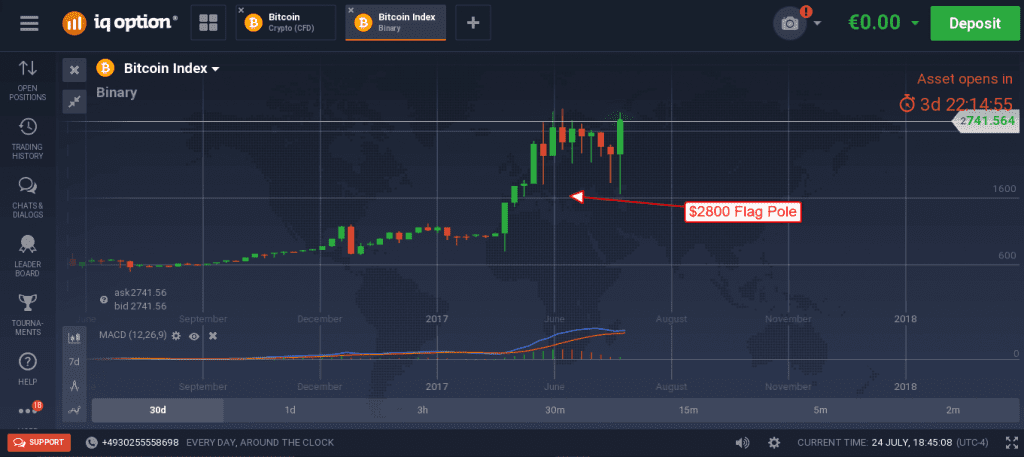
Looking out to the longer term, using the weekly charts, the upside potential is much greater. The correction which led to the rebound and flag pattern described above is itself a similar bullish continuation pattern with a much longer-term outlook. This signal carries a time horizon of 18 months to 3 years and may lead to a doubling of Bitcoins value. The coin has increased in value by $2,800 since hitting its bottom in 2015, a break to the upside past $3,000 could easily go as high as $5,800 on a technical basis. Once this move begins inflows of new money, chasing prices higher, could send it to $6,000 or above.


