US PPI, the producer price index (a measure of inflation), shows inflation at the producer level accelerated from the previous month and at a rate hotter than expected. The headline figure of 0.5% for the month of May is nearly double the expectation and drove YOY inflation through the 3.0% handle to register 3.1%. This news, otherwise bullish for the dollar, failed to move the currency in most major markets. Why? Because the FOMC is already expected to raise rates at the Wednesday meeting and outlook for future hikes has diminished.
At the core level producer level inflation rose at a more tepid 0.1%, steady from the previous month, but accelerated to 2.6% YOY. This figure supports the need for additional tightening from the FOMC but not so much to make the market think there will be two more hikes this year. As of this writing there is only a 50/50 chance at an additional two more hikes after the June hike, down from near 75% chance just a month or so ago.
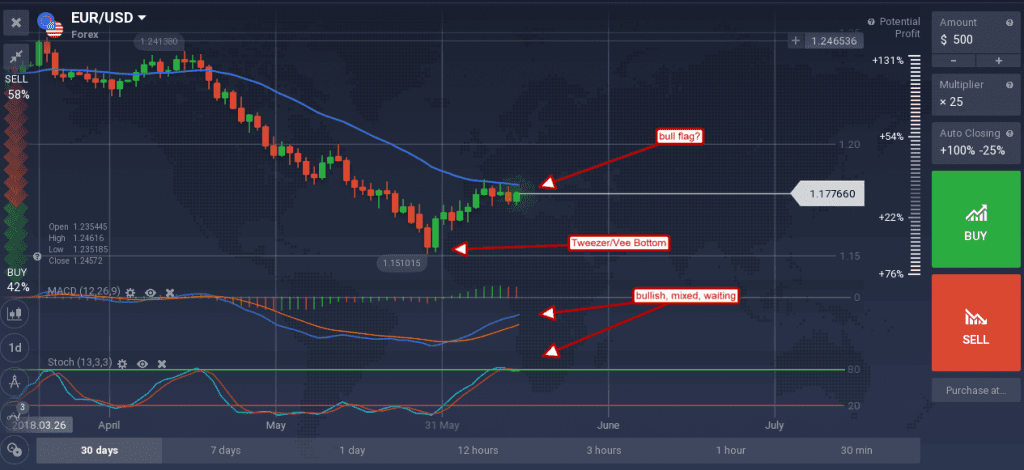
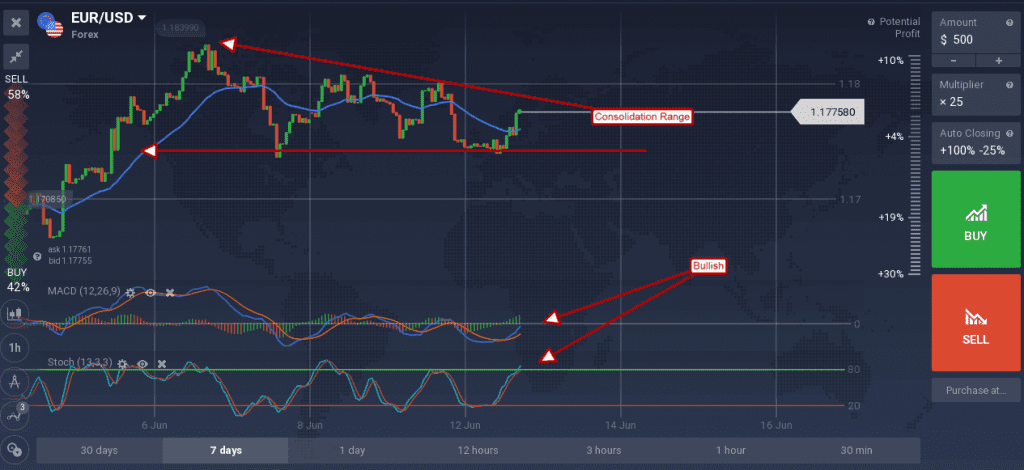
Couple this with an expectation for ECB hawkishness and you can understand why the EUR/USD is winding up within a consolidation range. Traders aren’t sure if the FOMC is going to sound dovish enough, or that the ECB will sound hawkish enough, to drive this pair higher. The risk is that either bank may fail to meet expectations, a situation that could keep the pair trapped within the near-term range, or that both will fail to meet expectations. If both fail to meet expectations the pair could fall from the current level in confirmation of the continuation of the dollars short term down trend.

A look at the hourly chart shows the pair trading near the midpoint of its consolidation range. The pair tried to move lower on the strong US data, but support kicked in and has sent it moving higher. The indicators are bullish so a move up to the top of the range could happen before the FOMC meeting but do not expect a break out until Wednesday afternoon following the announcement, or possibly Thursday morning when the ECB makes their policy statement.

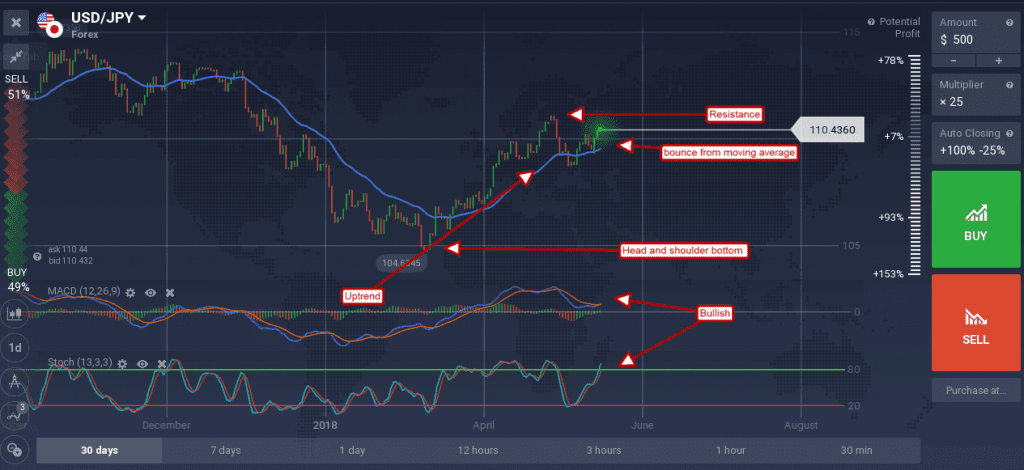
The dollar was able to move up against the Yen, extending a rally on the daily chart. The pair is moving up on the combined power of US data and outflow from the risk-off, safe-haven yen. The pair has now set a new one month high and is indicated higher. This move could be spurred by the FOMC, or the BOJ which is also meeting over the Wednesday/Thursday time.

The BOJ is not expected to make any changes to policy although they have begun to issue hawkish comments about the future. This pair may hit resistance at 111.00 or 111.50, a move above there would be bullish.

