The US housing market has long been a drag on current GDP. A market that would otherwise by roaring is stifled by low inventory and slow construction of new homes. This month’s data is good but does not show underlying change in the fundamental housing picture.
Existing home sales came in at 2.0% and well above the 1.1% expected by economists. This is a good read if down from the last month’s downwardly revised figures. That being said, it is the strongest pace of growth since early this summer and a sign of activity in the market. The bad news is that while strong, this month’s read leaves sales down -0.90% from last year.
Lawrence Yun, economist at the National Association of Realtors, says that tightening labor markets, wage inflation and outlook have home buyer sentiment improving. This is supporting a flow of traffic that is underserved by current inventory. The number of homes on the market is now -10.4% below the same time last year and at the lowest level recorded by the NAR.
The real problem in housing however is a shortage of buildable land. The big builders are running out of room to build new houses which is in turn preventing others from upgrading and opening inventory of new houses.
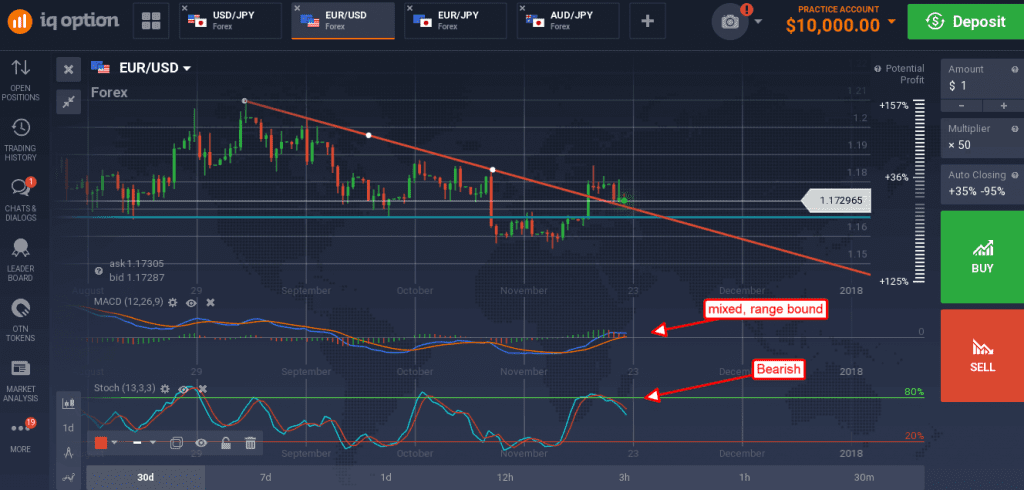
The USD gained marginally on the news and extended moves throughout the currency world that began with yesterday’s Leading Indicators. The index jumped 1.2%, double expectations, and indicates a period of strong growth for the US is ahead. The EUR/USD is now testing support along a down trend line and indicated to continuing falling along that trend line in the near term. MACD is still a bit bullish but retreating to 0 while stochastic is moving lower, consistent with the prevailing trend.

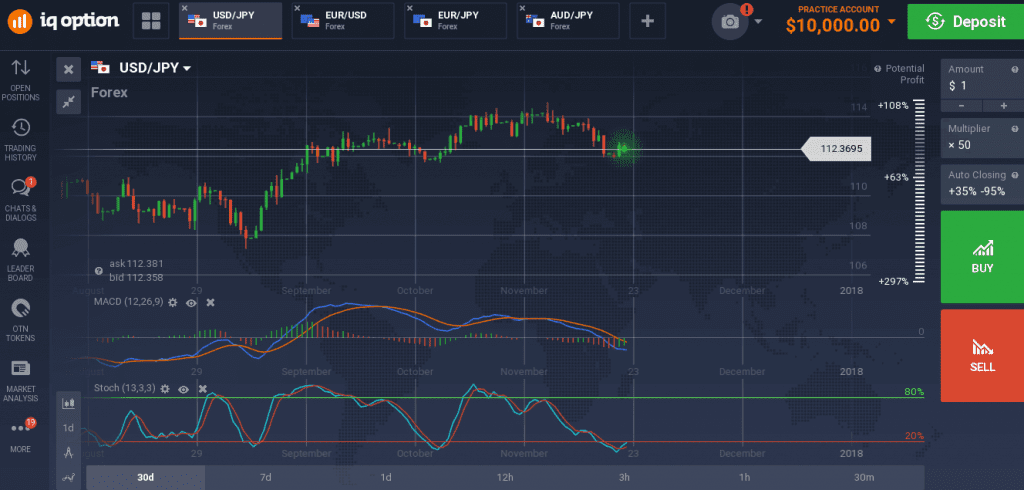
The USD/JPY held steady although today’s candle does reinforce the idea of support near current levels. The candle is a medium sized red candle but with visible lower shadow confirming support at the midpoint of yesterday’s long green candle. Yesterday’s candle is a bullish one confirming support at 112.00. MACD momentum and stochastic are both showing signs of support consistent with consolidation and/or a bounce that could lead to further upside. Target is near 114.00.

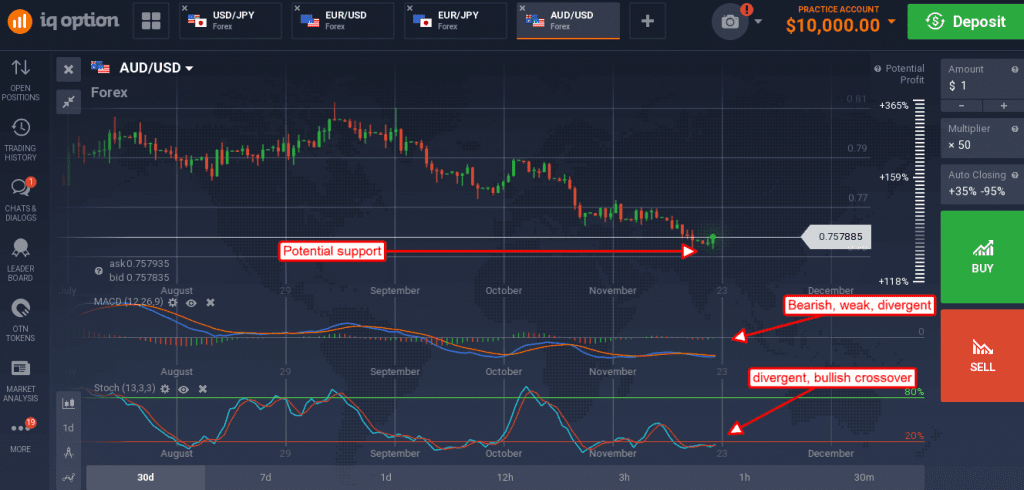
The AUD/USD had been moving up from yesterday’s support, but gains were capped by the home sales data. Meeting minutes from the RBA along with comments from a bank governor had the Aussis dollar gaining strength but it wasn’t enough to overpower the US data. This pair remain in downtrend although there is room for it to move higher in the near term. A continuation of today’s bounce could go as high as 0.7700 in the near term.

A move lower may find support at today’s low, near 0.7535, a break below which would be bearish. The indicators are a bit mixed but divergent from the new lows and suggesting a snap back rally could happen any time.

