The Historical Volatility Indicator is a statistical measure of volatility for a certain asset or security over a set period of time. It measures how much the asset price deviated from its average value over the set timeframe. This indicator does not show the direction of where the price is heading, but it is created to measure the deviation of the current price from the historical average.
How to use it in trading?
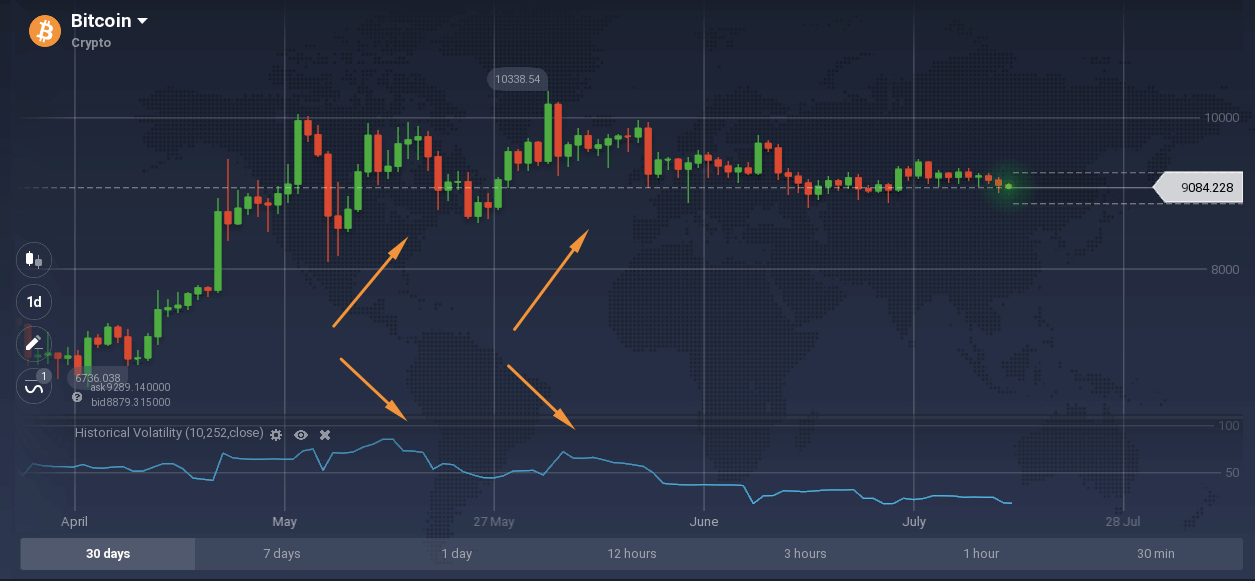
This indicator can be conveniently used to measure the volatility of the asset. When the Historical Volatility is rising, or it is higher than average, it means that the price is moving up and down more frequently and quicker than normal. It may be an indication of uncertainty on the asset and a sign of a possible trend change. In times of higher Historical Volatility, a trader may monitor the asset more closely.
When the Historical Volatility is low or falling, it may be a sign that the asset price is going back to normal and the uncertainty is removed.
Using this indicator in trading, it may be possible to determine whether the volatility on the asset is high or low and adjust the chosen trading strategy accordingly. The higher the asset’s volatility, the riskier it is. And a volatile market may require wider stop-loss and take profit levels and a higher margin.
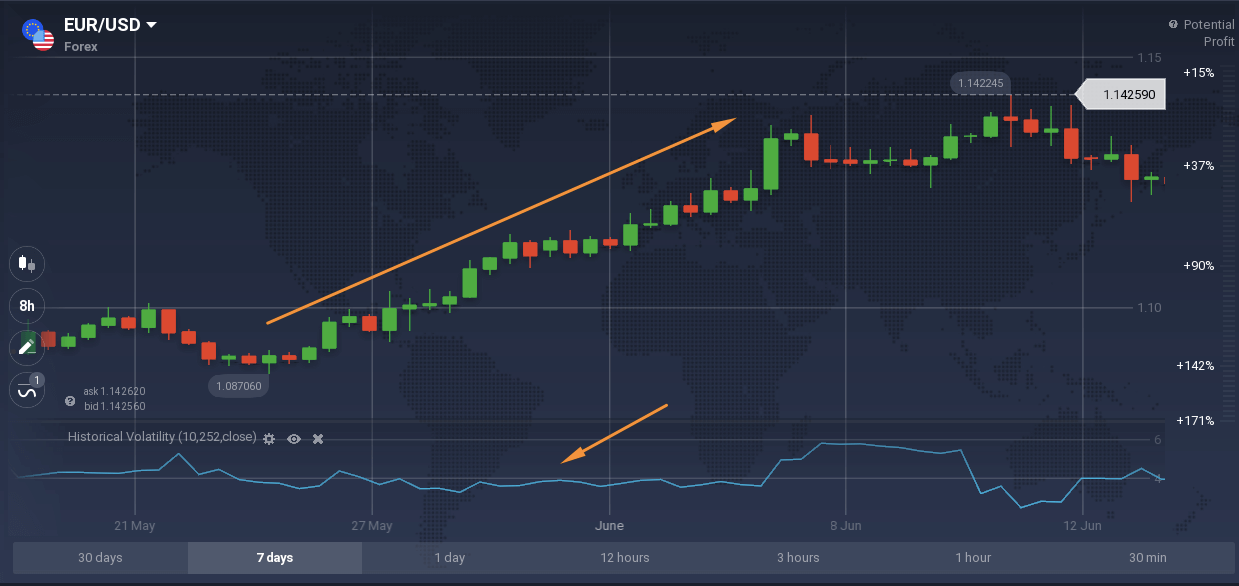
This indicator can also be used in trending markets: it measures how far the price is moving away from the average. If the indicator shows low volatility for a trending market, it means that the price does not fluctuate, but rather changes steadily and gradually over the pace of time.
What to combine it with?
Volatility indicators can be combined with trend lines and oscillators. One may use the Historical Volatility with QStick – a relatively easy to use trend indicator that is displayed in one horizontal line below the chart.
The volatility indicator may help determine the risk involved, as well as determine the stop loss levels, while QStick might assist with the entry points and the direction of the market. It is important to understand that no combination of indicators will bring a 100% guarantee of success. Every indicator may translate false signals from time to time and traders need to learn to distinguish them.
How to set it up?
To set up the Historical Volatility indicator, find it in the Volatility tab of the Indicators menu.
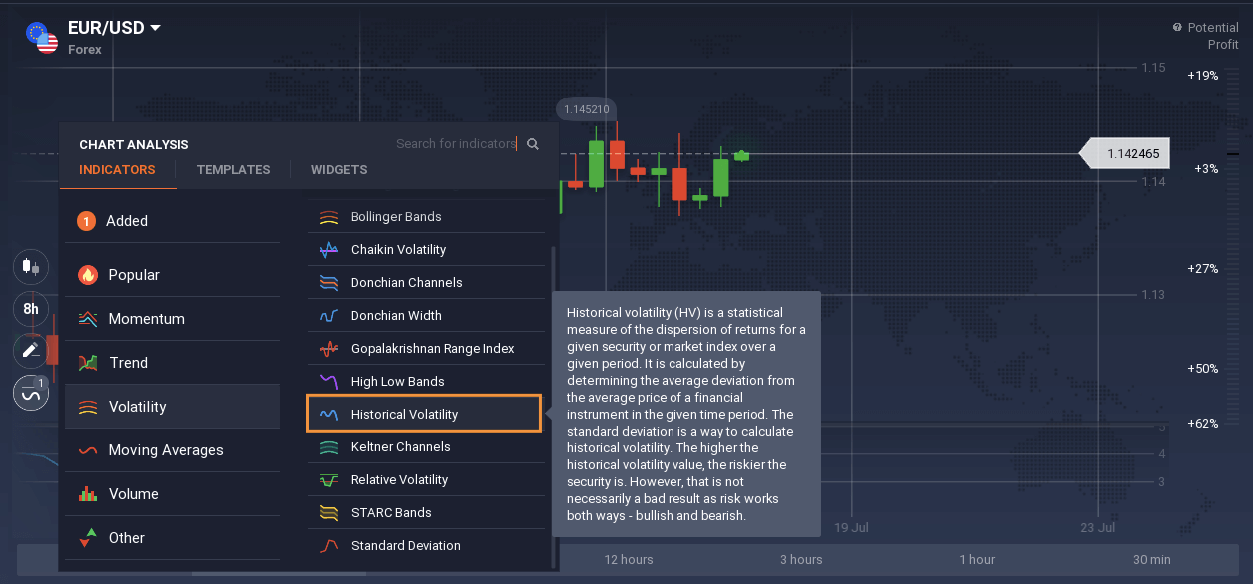
When setting the indicator up, you may save the default settings and use it immediately. Experienced traders may change the default settings and adjust the indicator according to their needs, as long as they understand the way the values are calculated.
Now that you learned how to use this indicator, you are welcome to proceed to the platform and try it out!
