The Williams %R indicator (also called the Williams Percent Range or Williams Overbought/Oversold Index) is a simple, yet effective technical analysis tool that excels at determining overbought and oversold levels. This indicator works best on intraday, daily, weekly and monthly time intervals. To use Williams %R effectively, you will have to understand how it works, what it is capable of and what are its limitations.
How does Williams %R indicator work?
Williams %R is an oscillator-type indicator, that is quite similar in its nature to the Stochastic Oscillator except for the difference in scales. The Williams Percent Range uses a 0 to -100 scale, while for the Stochastic, the readings vary from 0 to 100.
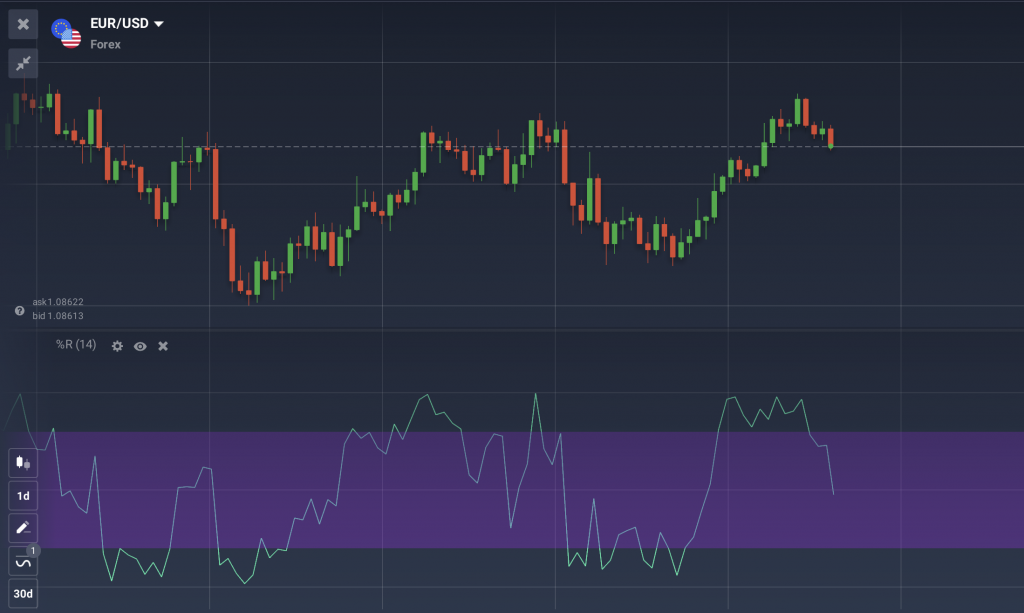
When the indicator’s readings get close to 0, it means that the current price is getting close to the highest price observed during the selected period. When the opposite is true, and the indicator gets to the -100 threshold, the current price is lower than the lowest price of the respective period. Finally, when the readings gravitate to the middle of the channel, the current price is equal to the average price of the selected period.
Trading with the Williams’ %R indicator: potential trading signals
What does it mean? Here are the main trading signals you may receive while using this indicator.
Overbought / Oversold levels
One of the key ways to use this tool is to apply it to the price chart to identify overbought and oversold levels of an asset.
☝️
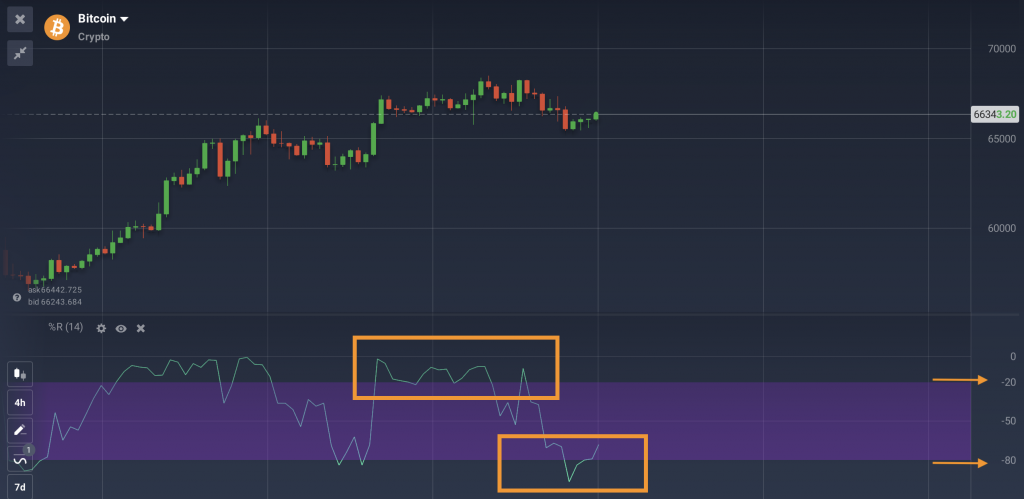
Don’t let the seeming simplicity of this tool fool you: overbought does not always mean the price is about to go down, just as oversold doesn’t necessarily mean that the price action will go through the roof. However, knowing about the overbought and oversold levels can be helpful when determining optimal entry points.
Momentum confirmations
In trading, momentum is just as important as the direction of the trend. A strong momentum means the trend is probably going to last for some time. Adversely, when the momentum becomes weaker, the trend runs out of its strength and can be expected to stagnate or even reverse. This kind of information is of great use to any trader.
Imagine you have spotted a newborn bullish trend. Should the %R reach -20 and stay above it, the current trend will probably last. If the opposite is true and %R stays below, the trend might be running out of steam and can, therefore, be expected to reverse.
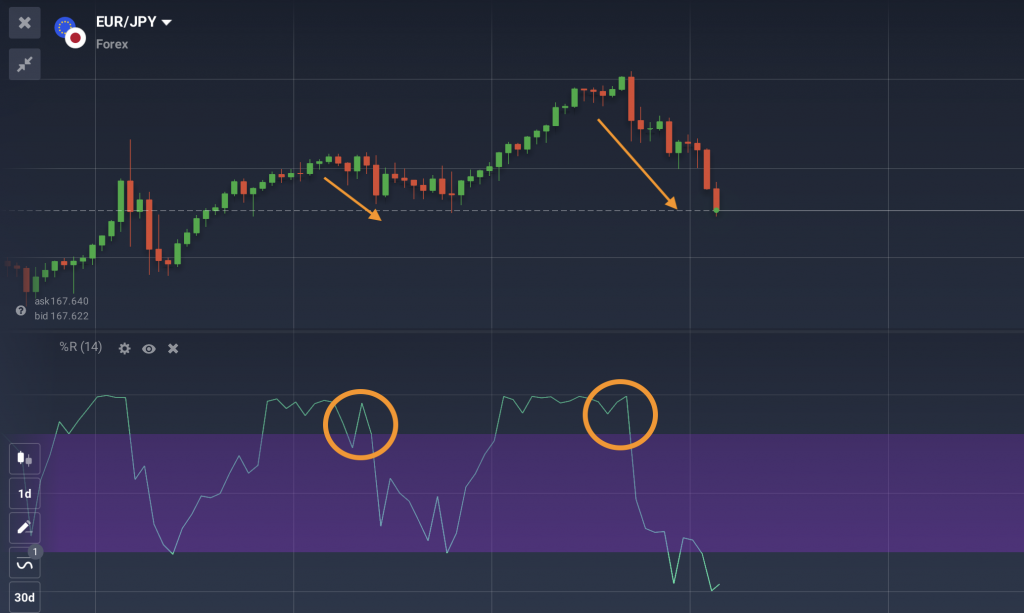
The same applies to the negative trends. When the indicator is below -80, the trend is stronger and can be expected to last. When it gets above the -80 threshold, the reversal is possible.
Williams %R indicator settings
The default period for the Williams %R is 14 candles. The indicator will, therefore, cover the period of 14 hours for a 1H graph, and 14 weeks for a 7D graph. However, it can be changed depending on your goals.
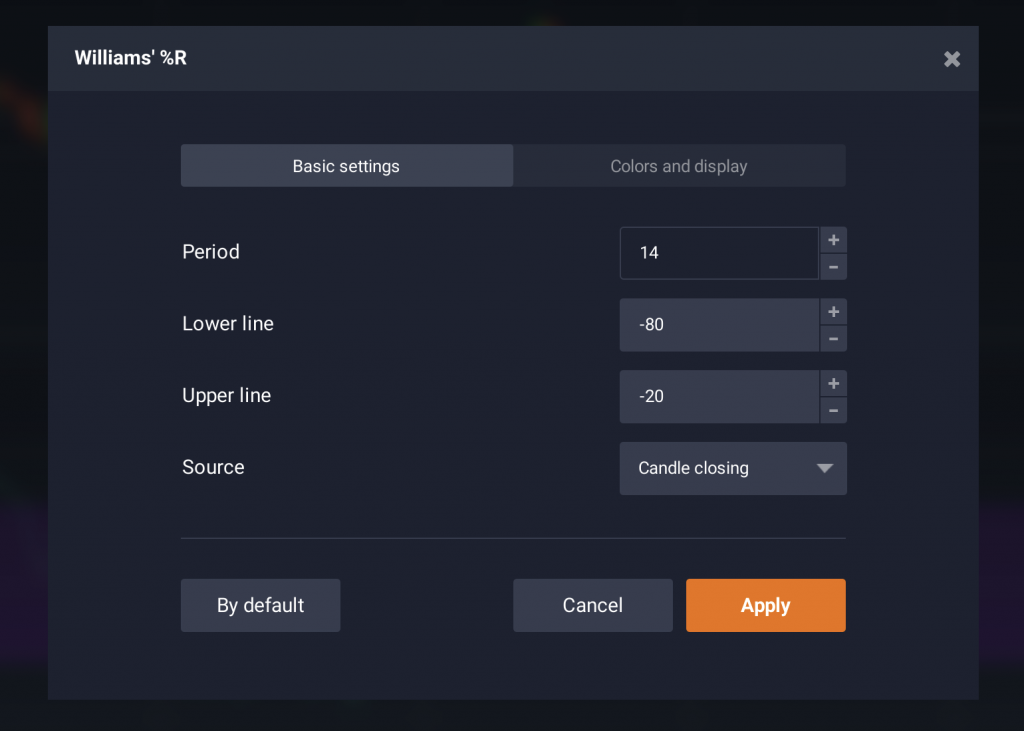
To increase the sensitivity of the instrument, you can take a shorter period. Or, on the contrary, decrease the number of potential false signals by choosing a longer period in the indicator settings.
Ready to try this indicator for technical analysis of the market? Head over to the IQ Option platform to give it a go!
