Financial markets can be unpredictable. That is why so many traders choose to apply different types of market analysis to make informed decisions. In this article, we will consider the topic of technical vs. fundamental analysis – two of the most popular types of market analysis. Having the facts may help you decide which approach might fit your trading goals and methods.
Technical analysis of the financial markets: 4 main points
The main idea of technical analysis is that the market acts as a near-perfect validating machine. Which means that the price chart already reflects all known factors that may be affecting the asset. Therefore, traders may study the charts to look for indications during the decision-making process.
Here are some of the main points at the focus of the technical analysis of the financial markets.
1. Historical market data
Technical analysis relies on historical market data, including trading volume and price movements. Keep in mind that while previous performance may offer valuable information about price movements, it does not provide reliable indications of future changes. Traders should treat the historical data as a reference for analysis that contributes to their trading approach.
2. Price chart focus
Unlike fundamental analysis, technical analysis of the financial markets doesn’t consider the underlying value of an asset. Instead, it highlights that past performance, as reflected in price charts, might offer more valuable information about market trends and asset behaviour.
3. Pattern recognition
Technical analysts actively seek patterns in price fluctuations, aiming to identify trends that may repeat over time. Therefore, some may look for these patterns when considering entering or exiting trades.
4. Supply and demand dynamics
Asset prices generally follow the basic laws of supply and demand. This means that reduced supply on the market might lead to increased demand and higher prices, and vice versa. Monitoring these dynamics may provide valuable insights into potential price changes.
Main tools of technical analysis
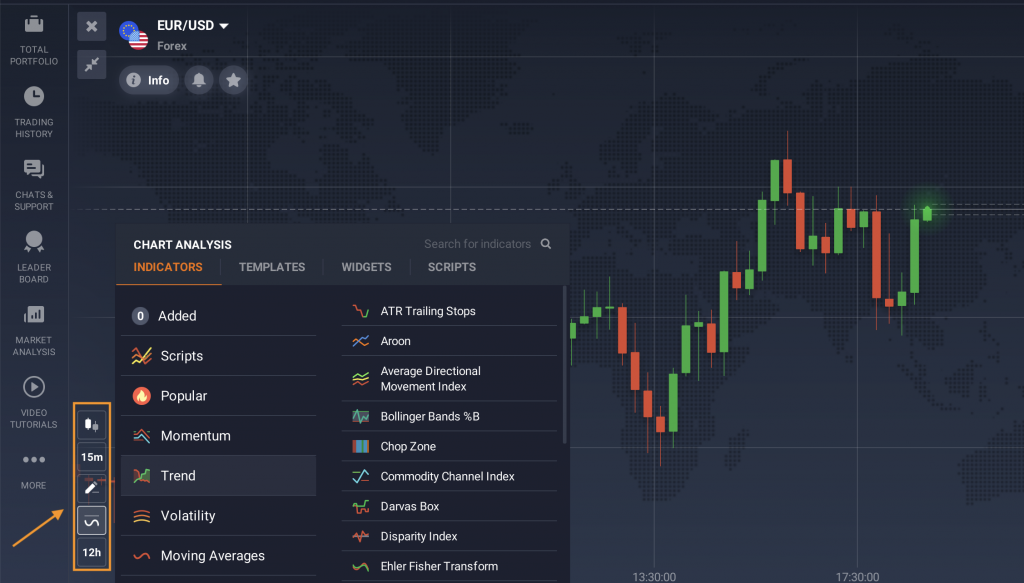
There is a wide variety of technical analysis tools available to traders on the IQ Option platform. These include 100+ technical indicators, trend lines, Fibonacci lines and much more. These tools might assist traders in analysing the charts, understanding price movements, spotting bullish and bearish trends and catching potential reversals. If you haven’t used technical indicators for trading, this detailed material about 5 top technical indicators may be a good place to start.

Fundamental analysis of the financial markets: 3 key ideas
Those who believe in fundamental analysis tend to pay more attention to understanding the underlying value of an asset. According to this approach, the true value of an asset is not always reflected by the market. This means that it may be difficult to assess the value of an asset only by looking at the price chart. Here are some of the main ideas to consider when using fundamental analysis for CFD trading.
1. Intrinsic Value Emphasis
Fundamental analysis attempts to evaluate an asset’s underlying value – its ‘true’ worth, which is not always reflected in the current market price.
2. Factors Considered
Fundamental analysis puts emphasis on the economic, financial, and political factors that may be affecting an asset’s price at any given time. That is why traders who prefer fundamental analysis keep track of market news and use the economic calendar to quickly react to any important changes. They also tend to study financial documentation, such as corporate reports, to get as much information as possible and make informed decisions.
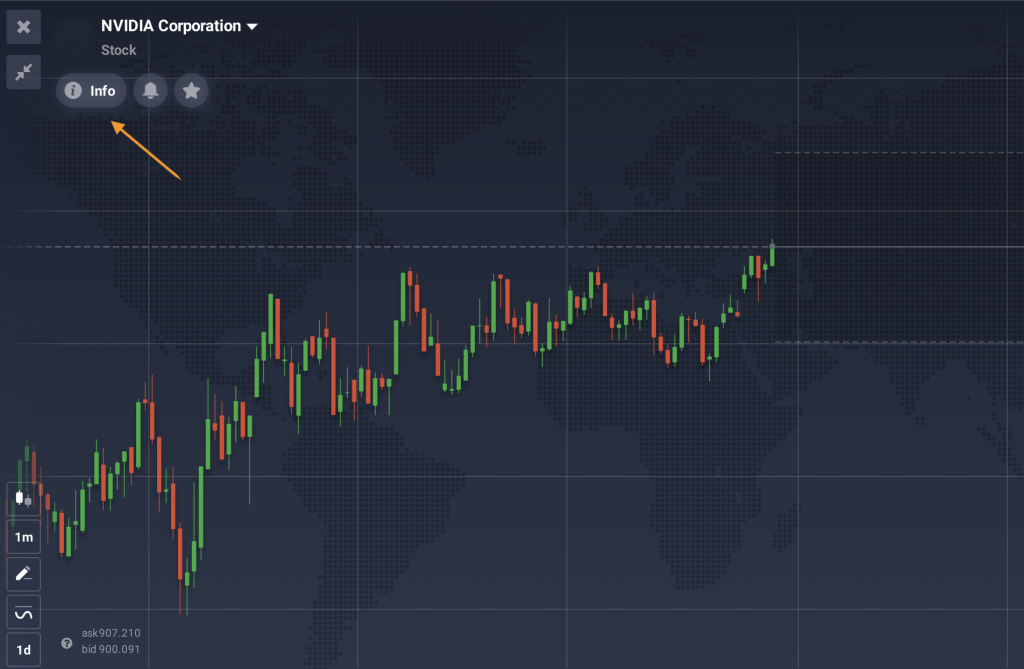
It may sometimes seem difficult to evaluate an asset’s potential, especially for novice traders. That is why the IQ Option platform offers information about an asset’s past performance and other important information for detailed analysis. You may find the data related to your CFD assets in the traderoom by clicking on the ‘Info’ tab below the asset logo.

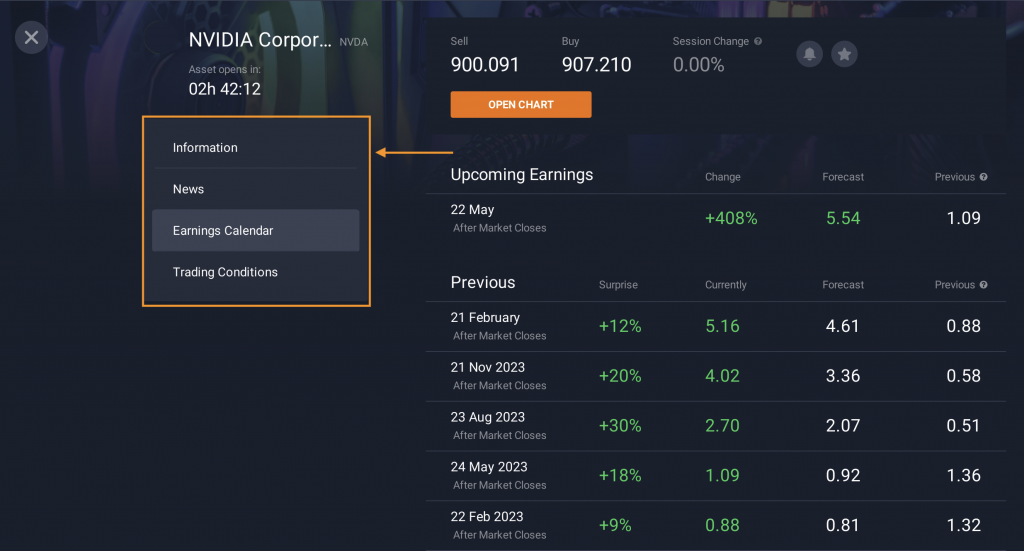
This section also includes the news and earning calendar. This may allow you to track upcoming events that may influence the price and adjust your approach in time.

For example, have a look at the last earnings report from NVIDIA. You may notice that the actual report data exceeded the forecast, which positively affected the asset price. Of course, you can’t find out the contents of an earnings report before it’s published. Still, the forecast and related news may contribute to your fundamental analysis and provide additional insights and indications to include in your trading approach.
3. Target Price Determination
One of the main goals of technical analysis in trading is to establish a target price that reflects an asset’s true value. Then traders may compare it with the current market price. The true value may be lower than the current price. In this case, some traders might expect an upcoming downward movement to reflect it. Conversely, the intrinsic value may exceed the market price. Then traders may keep an eye on a potential upward trend so that the price might reach its true level.
Keep in mind that even the most thorough analysis does not guarantee positive results. Yet, it may help prepare for different outcomes and manage your funds and risks effectively.
Technical vs. fundamental analysis: what is better?
The choice between fundamental and technical analysis may depend on various factors. Here are just a few of the points you may consider when picking a suitable approach for you.
Timeframe
Traders may lean towards fundamental analysis for longer timeframes, as it focuses on the underlying fundamentals of an asset and its potential growth. Conversely, technical analysis of the financial markets might often be used by day traders and those operating on shorter timeframes. This is due to its focus on short-term price movements and swift decision-making.
Choice of Assets
While commonly used for stocks, fundamental analysis may be applied to various assets.
The key is to understand which sources of information to use for analysis of different types of assets. For instance, in evaluating currency pairs on the Forex market, factors such as key interest rates, inflation rates, and GDP growth rates are crucial due to their significant impact on exchange rates.
Personal Preference
Some traders enjoy technical analysis, as it allows them to assess the trend in real-time and make swift decisions on short timeframes. Others like to spend time looking through financial statements and corporate reports to understand the true value of an asset.
There is also a third option: a hybrid method, which involves both fundamental and technical analysis. Combining these approaches may provide a more comprehensive overview of market dynamics. Fundamental analysis may provide the broader context, while technical analysis might assist in identifying short-term trends. It’s crucial to note that there is no assurance that either approach guarantees success.
It’s essential to consider your own trading style, objectives, and preferences when deciding what is better: fundamental or technical analysis. Remember, there is no one-size-fits-all approach, and a balanced integration of both techniques may offer a more nuanced perspective for informed decision-making in the dynamic world of trading.
In Summary
The choice between fundamental and technical analysis in trading ultimately depends on the trader’s preferences, timeframes and preferred assets. On the one hand, fundamental analysis attempts to assess the intrinsic value of an asset and its long-term perspectives. On the other hand, technical analysis of the financial markets might offer a more dynamic, quantitative approach based on historical data and pattern recognition. Some traders may opt for a combination of both methods to gain a more comprehensive understanding of the market, recognizing that neither approach guarantees assured success in the unpredictable realm of trading.

