A question I get asked a lot is, “Dojis are really important, right?”
The answer, like most in the world of technical analysis, is maybe. Dojis are important candles: they can give powerful indication of price direction. At the same time, however, not all carry the same weight. This is true of all candles for that matter. Just because a marubozu or spinning top or hammer forms does not mean that continuation, or consolidation, or reversal is at hand.
Why? The answer is simple: it’s because everything is relative to what is going on. To begin with, 90% of movement is totally random, meaning 90% of all candle patterns that form is meaningless. They are nothing more than the idle motion of the market as it goes about its daily routine. Sometimes the candles can be described as long, or a group of 2 or 3 may form some ominous signal, but the appearance of that candle or signal is random. It did not form because the market is gearing up to make a major move; it does not indicate a majority of traders are actively engaged with the asset.
- A doji is a candle with little to no “body” and visible shadows. The shadows, also known as wicks, indicate price levels where bullish or bearish advances were repelled.
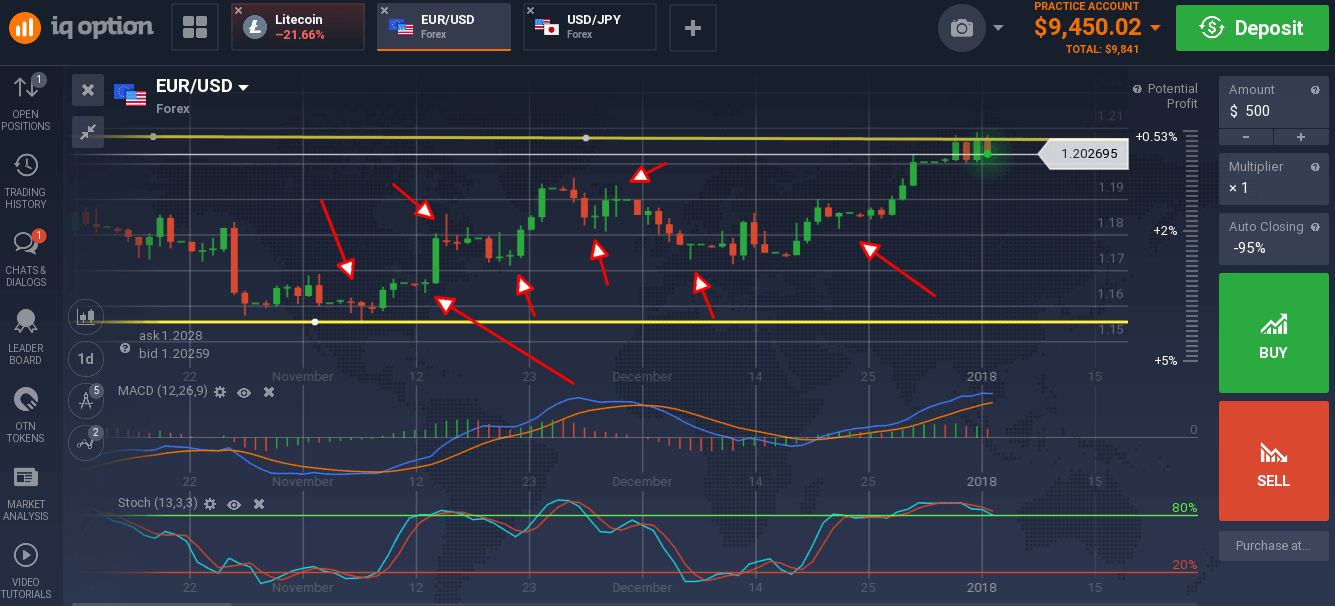
In the case of a doji, these candles form all the time. The market is almost always in some form of equilibrium and that is what a doji shows — balance. Prices open, they move up they move down, and they close where they started; there is a balance of buyers and sellers. Looking at the chart below, you can see a lot of dojis. I’ve pointed out just a few and none of them mean much.
What makes a good doji signal you may ask? Many things that can be applied to any candlestick. The first is where did it appear? Did it show up at or near a resistance/support target, near a moving average or at a retracement level, or did it appear far from any of these levels? The second is the magnitude of the candle. The larger the doji, the stronger it is. The third is what kind of doji it is. I mean, are the shadows balanced or is one side larger than the other?
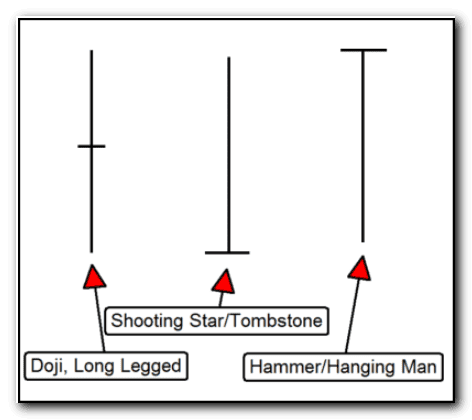
- A doji with extremely long upper and/or lower shadows is called a long legged doji.
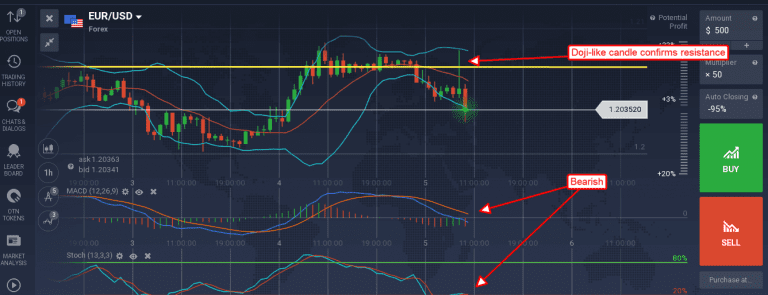
Consider the chart below. This is the one-hour chart of the EUR/USD showing a strong doji confirming resistance. This resistance is the top of a long-term trading range that has been dominating the pair for 3 months. This doji has an extremely long upper shadow and small green body, not a true doji but it does qualify. This magnitude of the doji is much larger than other candle on the chart and further confirms its strength.
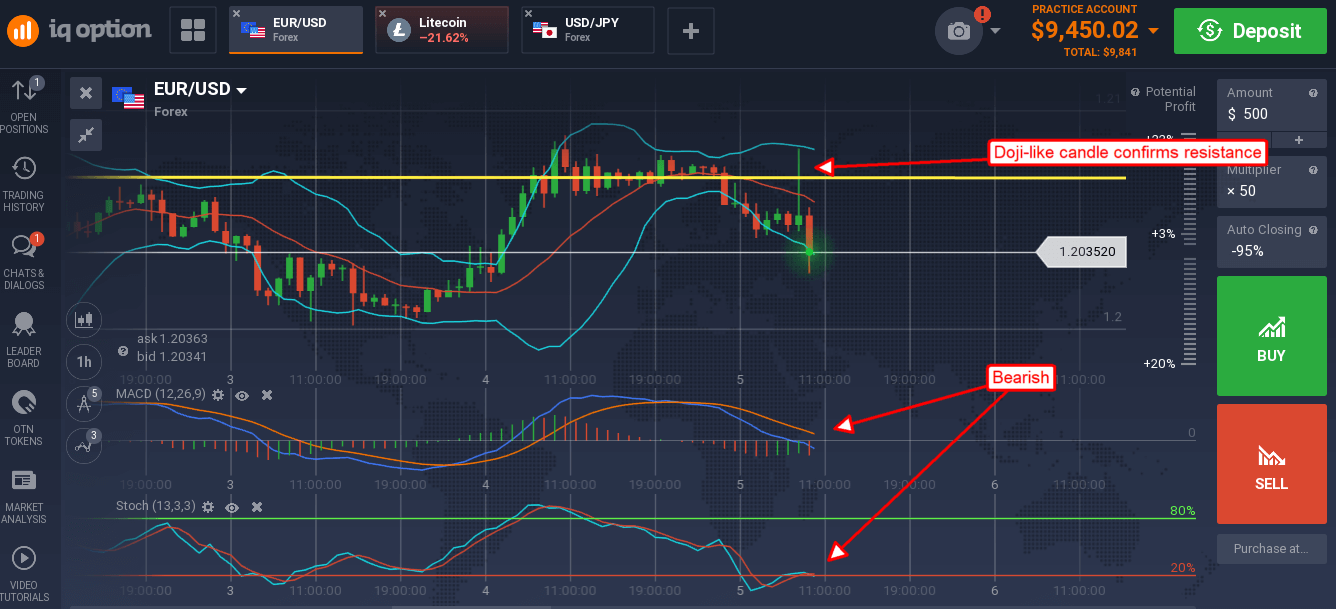
It not only confirms resistance at the top of the range it also confirms resistance at the 30-bar moving average and a reversal at resistance that has been building over the past few trading days.