The economic calendar in the forex market today has economic news and reports mainly during the American and Pacific Sessions, with the releases of the S&P/Case-Shiller Home Prices Indices, the API Weekly Crude Oil Stock, the US Consumer Confidence Index, and the Trade Balance for New Zealand. There are several speeches by senior central bank officials, both from the Fed and the ECB, and in the European Session the UK Finance Mortgage Approvals.
These are the most important events in the forex market calendar for today to focus on:
European Session
- Eurozone: ECB Coeure Speech, UK: Finance Mortgage Approvals
Time: 02:20 GMT, 08:30 GMT
The Mortgage Approvals measure the number of home loans issued by the British Banker’s Association (BBA) during the previous quarter, considered as a leading indicator of the UK Housing Market. A growth in mortgages represents a healthy housing market considered positive for the overall UK economy and the British Pound. The forecast is for an increase of the Mortgage Approvals at 38.2K, higher than the previous reading of 38.0K.
The Speech by ECB Coeure can influence the Euro if there are any updated economic projections or statements on the current economic conditions in the Eurozone.
American Session
- US: S&P Case-Shiller Home Price Index (YoY, Mom), CB Consumer Confidence, Fed Bostic Speech, Fed Kaplan Speech, API Crude Oil Stock Change
Time: 13:00 GMT, 14:00 GMT, 17:00 GMT, 17:45 GMT, 20:30 GMT
Conference Board (CB) Consumer Confidence measures the level of consumer confidence in economic activity, considered a leading indicator as it can predict consumer spending, which plays a major role in overall economic activity. Higher readings are considered positive and supportive for the US Dollar reflecting increased optimism, which can have a positive effect on consumer spending leading to higher economic growth. The forecast is for an unchanged reading of 128.0.
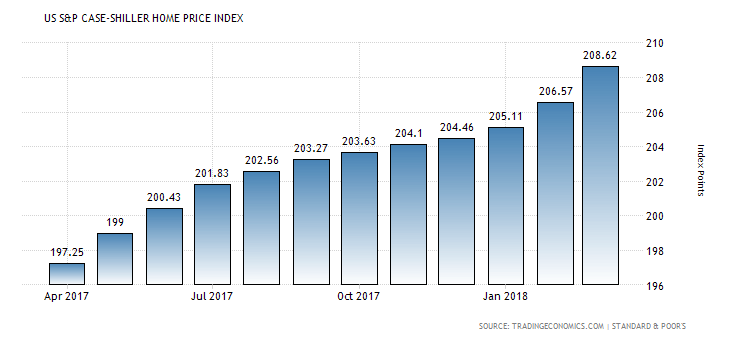
The S&P/Case-Shiller Home Price Index measures the changes in the value of the residential real estate market in 20 regions across the US, considered also an indicator for the health of the US housing market. Higher values reflect a robust housing market and the presence of inflationary pressures in the economy.

“The S&P CoreLogic Case-Shiller 20-City Composite Home Price Index in the US rose 6.8 percent year-on-year in March of 2018, the same as in February and above market expectations of a 6.5 percent gain. It remains the highest increase in house prices since an 8.1 percent climb in June 2014, with Seattle (13 percent), Las Vegas (12.4 percent) and San Francisco (11.3 percent) reporting the sharpest gains among the 20 cities. Meanwhile, the national index, covering all nine US census divisions rose 6.5 percent, also the same as in February.”, Source: Trading Economics.
As seen from the above chart the S&P Case-Shiller Home Price Index is trending up as of April 2017, indicative of a strong US housing market. The forecast is for an unchanged yearly figure of 6.8%.
The API Weekly Report provides important information and an overview of the US petroleum demand. If the increase in crude inventories is more than expected, this implies a weaker than demand and is considered negative bearish for crude oil prices. The Speeches by the senior Fed officials can provide a short-term trend for the US Dollar depending on their updated statements on economic developments and conditions.
Pacific Session
- New Zealand: Trade Balance (YoY, MoM), Exports, Imports
Time: 22;45 GMT
A positive trade balance reflects a high competitiveness of a country’s economy, capital inflows in the country, increased demand for goods and services denominated in local currency, which should lead to the natural appreciation of the currency, in this case the New Zealand Dollar versus other currencies.
As seen from the chart “New Zealand posted an NZD 263 million trade surplus in April 2018, compared with a NZD 547 million surplus in the same month of the previous year and market expectations of a NZD 200 million surplus. Exports rose 7.3 percent from the previous year to NZD 5054 billion and imports jumped 15.1 percent to NZD 4791 billion.”, Source: Trading Economics.

The forecast is for a decline of the monthly trade surplus at 100M New Zealand Dollars, lower than the previous reading of 263M New Zealand Dollars, and a narrower yearly trade deficit of -3.74B New Zealand Dollars, lower than the previous figure of -3.76B New Zealand Dollars. Both monthly exports and imports are expected to increase.

