
The new trading week in the forex market for July 23-27, 2018 includes a plethora of key US economic data, the advance estimate of second-quarter GDP growth, existing and new home sales, durable goods orders and flash Markit PMIs. The ECB will decide on the monetary policy, which may or not move the Euro, but most probably will add volatility in the forex market. Other important releases include: UK CBI factory orders; Eurozone flash Markit PMIs and consumer confidence; France Q2 GDP growth rates; Japan Nikkei Manufacturing PMI; and Australia inflation.
For today the forex market economic calendar includes only a few major economic events, mainly for the US Dollar and the Euro. Low to moderate volatility should be expected.
These are the key economic events in the forex market for today to focus on:
European Session
- Germany: Bundesbank Monthly Report, Eurozone: Consumer Confidence Flash, UK; BoE Broadbent Speech
Time: 10:00 GMT, 14:00 GMT, 17:00 GMT
German Buba Monthly Report contains important economic information such as relevant articles, statistical tables, and provides detailed analysis of current and future economic conditions from the bank’s viewpoint.
Higher than expected readings for the Consumer Confidence in the Eurozone are considered positive for the Euro. The Consumer Confidence is a leading index that measures the level of consumer confidence in economic activity. A high level of consumer confidence is expected to stimulate economic expansion. “The consumer confidence indicator in the Euro Area came in at -0.5 in June 2018, in line with the preliminary estimate and below May’s 0.2. It was the lowest reading since last October due to more negative assessments of the future general economic situation, future unemployment and, in particular, consumers’ savings expectations. Only the views on households’ future financial situation remained broadly stable. “, Source: Trading Economics.
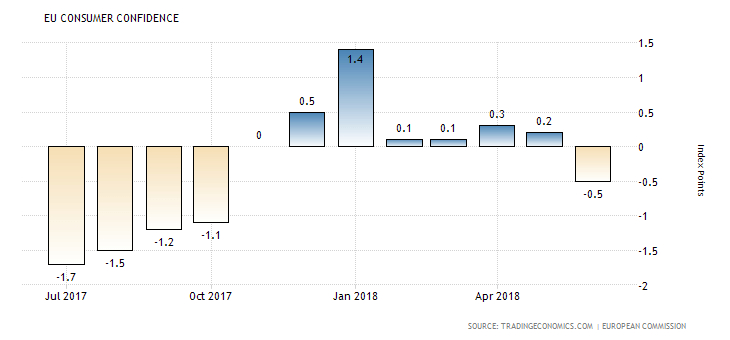
As seen from the chart the Consumer Confidence in the Euro area in 2018 has peaked in January having the maximum value of 1.4. Since then it has been in a downtrend, and rather weak at current very low interest rate environment. The forecast is for a figure of -0.75 lower than the previous negative reading of -0.50. If this reading comes true upon its release it will be the second consecutive month of negative readings, which may influence negatively the Euro.
American Session
- US: Existing Home Sales MoM, Existing Home Sales
Time: 14:00 GMT
The Existing Home Sales are an important economic indicator of the housing market conditions. The housing market is considered as a sensitive macroeconomic factor to the US economy, reflecting in a large degree the overall economic strength. Higher than expected readings are considered positive and supportive for the US Dollar.
“Sales of previously owned houses in the US declined 0.4 percent month-over-month to a seasonally adjusted annual rate of 5.43 million in May of 2018 from a drownwardly revised 5.45 million in April. It compares with market expectations of a 1.5 percent jump to 5.52 million. Sales of single family houses went down 0.6 percent to 4.81 million, following a 3 percent slump in April while sales of condos rose 1.6 percent to 0.620 million after being flat in the previous month. The median house price increased to $264,800 from $257,900 in April and the months’ worth of supply edged up to 4.1. In addition, the number of houses available in the market increased to 1.850 million. Year-on-year, existing home sales rose 5.6 percent.”, Source: Trading Economics.
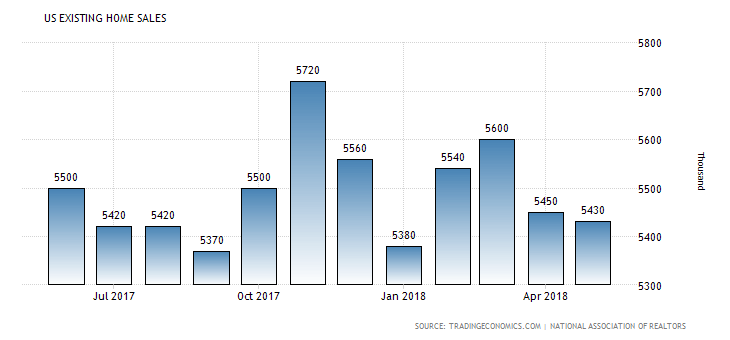
The US Existing Home Sales in 2018 have peaked in March, and ever since have been declining. This may be due to seasonality factors, but a sustainable downtrend raises concerns about the state of the US economy, mainly its GDP growth. The forecast is for an increase of the monthly US Existing Home Sales with an expected figure of 5.47M, higher than the previous figure of 5.43M, a monthly increase of 1.5% versus the previous decline of -0.4%.
