In trading, minutes and even seconds often play a huge role and might determine the result of the deal. This is why entering and exiting a deal at the right time is so important: sometimes a wrong entry or a late exit can lead to a loss. Timing the deals correctly is one of a trader’s tasks: it is not just a way to implement their trading approach, but also a risk management tool. Technical analysis is often used to assess the chart and find the optimal trading conditions.
There are many technical indicators to choose from, and all of them can be classified into several groups. For instance, trend indicators are meant to follow the price and indicate the current trend or the possibility of a price reversal. Momentum indicators show the strength of the price movement over time, while volume indicators are self explanatory. The DeMarker indicator is a kind of oscillating indicator that was developed to indicate high-risk buying or selling areas in a given market.
What is the DeMarker indicator?
The DeMarker indicator was developed by technical analyst Thomas DeMark, who introduced his own approach to trading and promoted his trading principles in his books. DeMarker is considered a leading indicator, it is used for identifying the overbought and oversold market levels and assessing possible risk levels. Essentially, the indicator resembles other oscillators like RSI or Stochastic. However, the calculation of this indicator is different: it focuses on intra-period highs and lows rather than closing levels like RSI.
Originally, the DeMarker indicator was created with daily bars in mind, so it could be applied on short timeframes. However, the indicator is not limited to daily trading: it can be used on any asset and any timeframe. It is often used in combination with other technical analysis tools, especially with trend indicators.
How to use it in trading?
The scale of this indicator from 0 to 100 displays the state of the market. Levels above 70 tend to indicate that the asset is extremely overbought, while levels below 30 signal that the asset might be oversold.
- Once the indicator shows that the asset reached its overbought or oversold level, a price reversal to a downtrend might be expected. This can be seen in the example below.
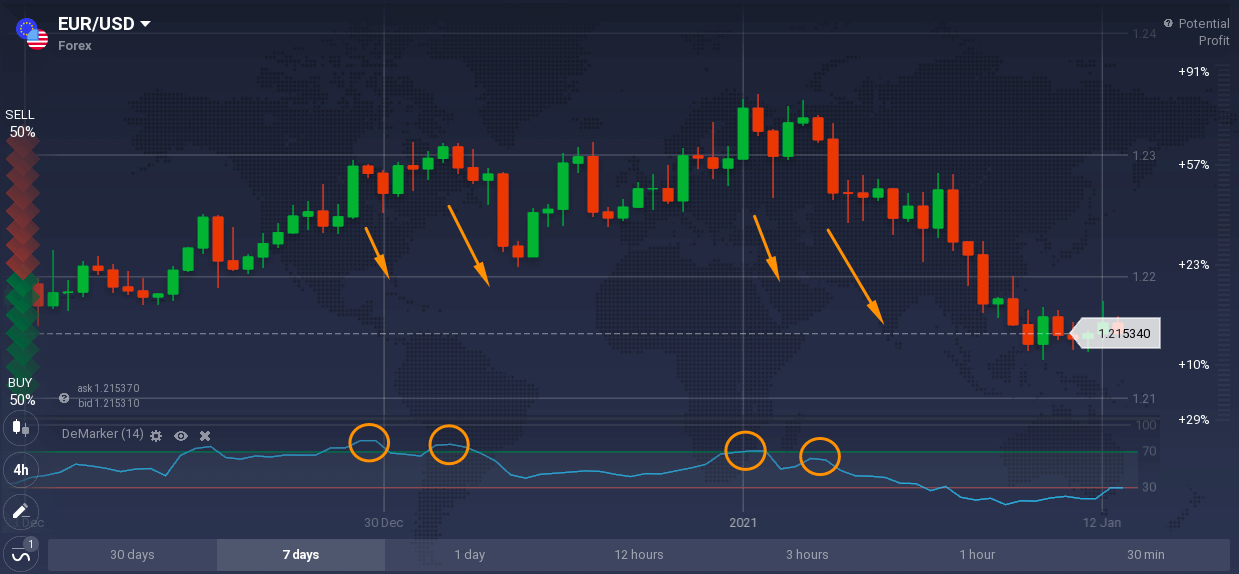
The indicator shows overbought areas for EUR/USD, where the indicator is approaching the 70 level or goes beyond it. This is followed by a trend reversal, where the price starts dropping down.
- The opposite can be spotted when the indicator hits or dips below the 30 level — the asset is considered oversold and the trend might be expected to reverse upwards.
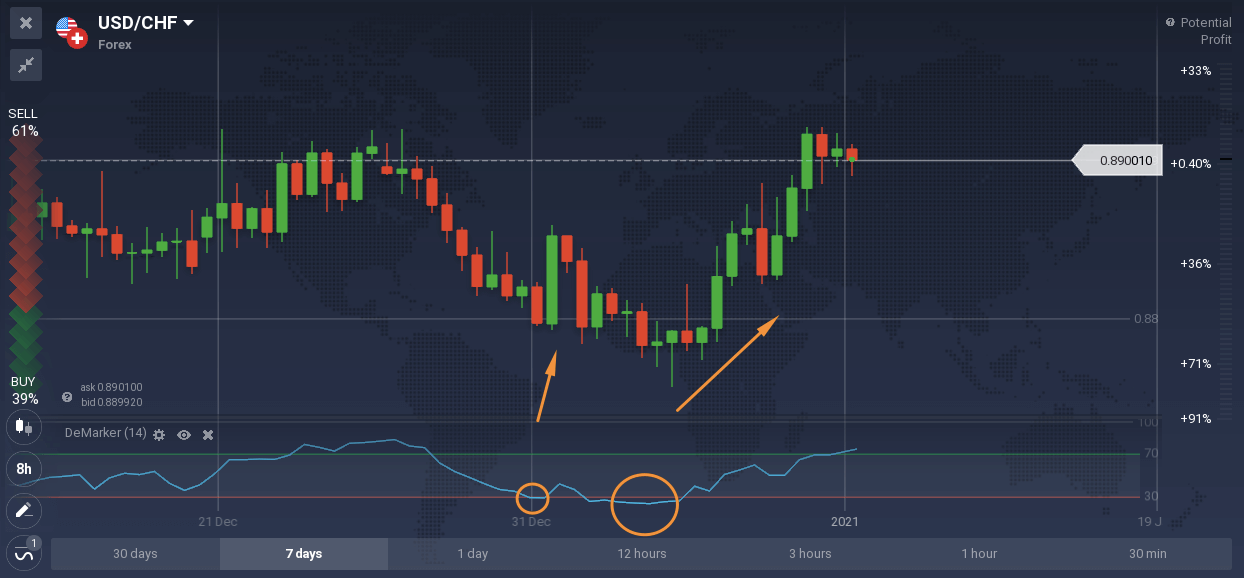
In the example above, USD/CHF price dips below the oversold level, which is followed by a price reversal, with the asset price going up.
Though it is a useful tool, it does not guarantee 100% results and can sometimes display false information. For more accurate signals, DeMarker may be combined with trend indicators, for instance, with Moving Averages, Bollinger Bands or Alligator.
How to set it up?
In order to use the DeMarker indicator, find it in the “Momentum” section of the Indicators menu as shown below. You may also find a short description of the indicator if you hover the cursor over its name.
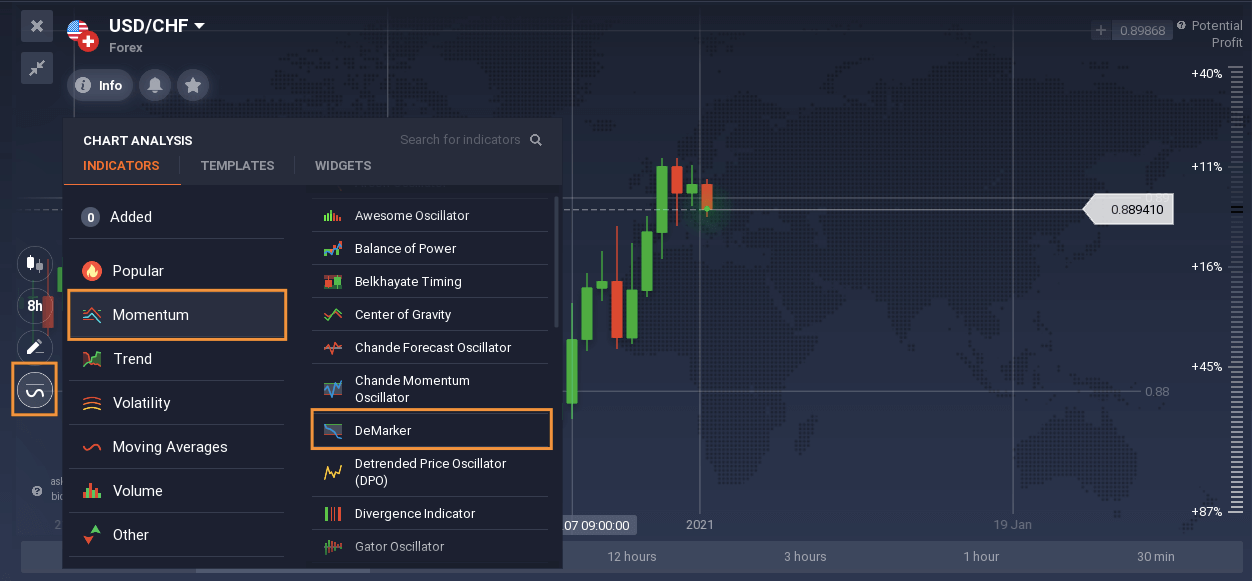
The standard settings for the indicator on the platform are a period of 13 with overbought and oversold levels at 80 and 20 respectively. These settings may be considered as more “conservative” as the indicator is slightly less sensitive to price changes, which potentially could minimize the amount of false signals.
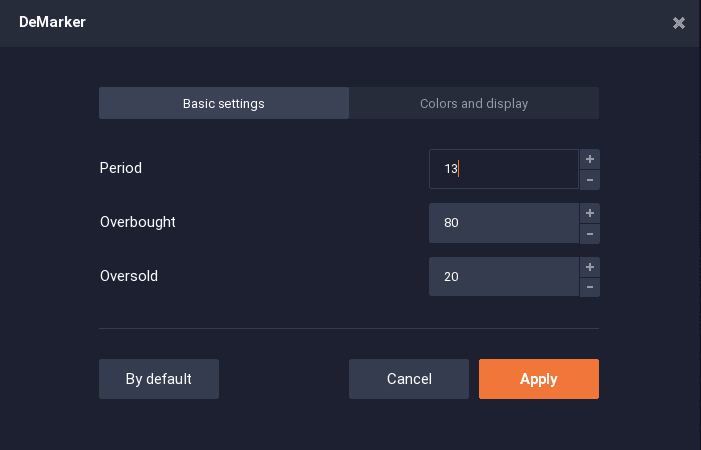
More experienced traders can change the settings according to their approach. For instance, in the examples above the indicator was set with levels of 70 and 30 and a period of 14. It is also possible to change the colors of the indicator’s lines if needed.
The DeMarker indicator might be a good addition to your trading strategy, regardless of your trading preferences. However, it is important to note that regardless of the settings, the indicator could still show incorrect signals, so double checking the information and implementing risk management techniques might be a sound decision.
